Download
1 / 13
130 likes | 1.2k Views
V.R. Eaton High School Attendance Boundary. December 16, 2013. NISD Growth History. Sept 00 5,373. Sept 01 5,641. Sept 04 7,595. Sept 05 8,678. Sept 06 10,354. Sept 07 11,804. Sept 09 14,100. Sept 10 15,400. Sept 11 16,600. Sept 12 17,800. Sept 13 19,001. Sept 02 6,199.

E N D
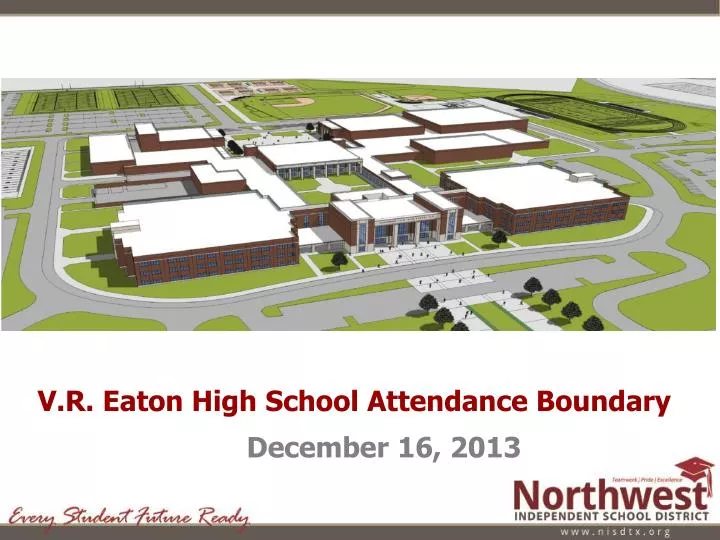
V.R. Eaton High School Attendance Boundary December 16, 2013
NISD Growth History Sept 00 5,373 Sept 01 5,641 Sept 04 7,595 Sept 05 8,678 Sept 06 10,354 Sept 07 11,804 Sept 09 14,100 Sept 10 15,400 Sept 11 16,600 Sept 12 17,800 Sept 13 19,001 Sept 02 6,199 Sept 03 6,891 Sept 08 13,026 268 5% 558 9% 692 11% 704 10% 1,083 14% 1,676 19% 1,459 14% 1,222 11% 1,074 8.5% 1,300 9% 1,200 8% 1,200 7.3% 1,200 6.7% September 2017 projected enrollment 25,000 students
2001-02 Enrollment- 5,641 2012-13 Enrollment 17,800 9,066 Students 2,740 Students 2,251 Students 1,271 Students
Northwest High School- Projections • 2014-15 2,890 • 2015-16 3,109 • 2016-17 3,335 • 2017-18 3,499 • 2018-19 3,691 • 2019-20 3,866 Current High School Boundaries Please note the enrollment projections are based on the actual 2013-14 enrollment and do not reflect the impact of the academies Northwest High School Byron Nelson High School • Byron Nelson High School- Projections • 2014-15 2,399 • 2015-16 2,552 • 2016-17 2,670 • 2017-18 2,960 • 2018-19 3,246 • 2019-20 3,510
Northwest High School- Projections • 2014-15 2,890 • 2015-16 2,256 • 2016-17 2,127 • 2017-18 2,200 • 2018-19 2,354 • 2019-20 2,518 Proposed High School Boundaries Please note the enrollment projections are based on the actual 2013-14 enrollment and do not reflect the impact of the academies Northwest High School Byron Nelson High School V.R. Eaton High School • V.R. Eaton High School- Projections • 2014-15 0 • 2015-16 1,035 • 2016-17 1,627 • 2017-18 2,029 • 2018-19 2,219 • 2019-20 2,374 • Byron Nelson High School- Projections • 2014-15 2,399 • 2015-16 2,371 • 2016-17 2,251 • 2017-18 2,231 • 2018-19 2,365 • 2019-20 2,483
50 Northwest Independent School District 2012 Development Map 49 51 37 36 48 46 47 8 42 35 43 44 39 41 56 45 9 38 40 5 1 2 6 34 7 4 55 54 10 33 31 3 32 11 12 19 29 22 21 13 55 20 14 27 28 26 30 25 15 16 52 23 18 17 24 53 53
Developments Forecasted in the NISD Central Area Traditions 10,000 McKelvey Ranch 1,700 Brookfield 600 Elizabeth Creek 539 Shale Creek 652 Rivers Edge 311 Total Lots in the Central Area 13,852 Lots
May 2013 November 2013
V.R. Eaton High School Attendance Boundary December 16, 2013