Download
1 / 16
180 likes | 370 Views
Biased Electrode Experiment. S.J. Zweben, R.J. Maqueda, L. Roquemore, R.J. Marsala, Y. Raitses, R. Kaita, C. Bush R.H. Cohen, D.D. Ryutov, M. Umansky (LLNL). • Motivations and previous results • Hardware upgrades for 2008 • Initial results from 2008 • Experiments for 2008.

E N D
Biased Electrode Experiment S.J. Zweben, R.J. Maqueda, L. Roquemore, R.J. Marsala, Y. Raitses, R. Kaita, C. Bush R.H. Cohen, D.D. Ryutov, M. Umansky (LLNL) • Motivations and previous results • Hardware upgrades for 2008 • Initial results from 2008 • Experiments for 2008 NSTX group mtg 2/18/08
Motivations • Increase SOL width using localized poloidal electric fields (based on ideas of Cohen, Ryutov, et al) • Understand physics of electric field penetration in plasma (surprisingly little is known from measurements) • - Vr (cm/sec) = 108 Epol(V/cm)/B(G) • SOL ‘width’ increases by x10 when: • => Vr (ExB) / Vr (blob) ~ 10 @ 30 V/cm • seems much easier than stochastic B ! Vrad blob Epol ⊗ B
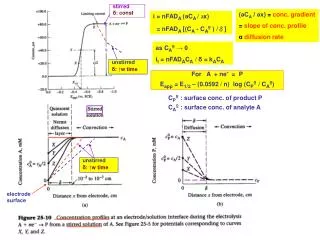
Simplest Theory of Electrode Biasing (Ryutov, Cohen et al PPCF 2001) plasma potential along B potential vs. bias voltage plasma potential bias • For + bias,Vp ~ Vb - (few)Te/e ; for - bias, Vp ~ - 0.8 Te/e • Voltage drop from parallel (Spitzer) resistance is negligible • Increase in current collection area A (e.g. due to cross-B- field electrical conductivity) can decrease Vp
Previous Results from DITE (Pitts and Stangeby PPCF 1990) • Plasma potential goes+with+plate bias • Expect peak in Vp at LII ~ ei (ei ~100 cm in NSTX SOL)
Previous Results from TEXT (Winslow et al PoP 1998) potential change @ 12 m • For +50 V bias on ‘driver’, see + 15 V @ 12 m along B • Radial and poloidal scales of potential change ~ 1 cm
Hardware Upgrades for 2008 • Two positive supplies increased from ~10 A to ~30 A • Added radial array of probes to measure local SOL • Now have 2 fast camera views of BEaP electrodes electrode (3x3 cm) GPI puffer radial probe array B cable shield BEaP
BEaP Goals for 2008 • Measure effect of increased positive bias (up to +100 V) • Measure effect of bias on SOL with radial probe array • View effects of biasing on visible light near electrodes • Evaluate effect of ‘floating electrodes’ (like double-probe)
Initial Results from 2008 • Biased electrodes in ‘piggyback’ mode on shots with NBI • Electrodes biased up to ±90 V and sometimes ~ 30 A • Good radial probe data on floating potential and density • Good images of GPI turbulence and BEaP electrodes • However, uncontrolled plasma position was a problem => ready to do 1/2 day electrode biasing XP #806 when plasma is better controlled
Electrode Voltages and Currents electrode voltages of ± 90 volts @ 4.5 kG, 0.8 MA, 3.6 MW #126648 VE1 IE1 + E1 - VE2 E2 IE2 + E3 VE3 IE3 E4 Edge of RF ant.
Floating Potential Effect • probe floating potentials go +10-20 volts with + 90 V bias #126648 VE1 + E1 P1 VP11 - E2 P2 + E3 VP2 P5 E4 VP3
SOL Profile Effect ? • Electric field of 100 V/cm between E2 and E3 (Vr outward) • Radial probe array shows some increase in SOL width ? #126663 VE3 + E1 IP2 P2 P3 - P4 E2 + IP3 E3 - E4 IP4
Radial Turbulence Velocity • Cross-correlate fluctuations in three radial probes • Some evidence for increased Vr with electrodes on (156-165 ms) (146-155 ms)
Wide Angle View of BEaP • No significant light from of BEaP during normal plasma BEaP location (enhanced) normal image w/ or w/o bias ~ 30 amps in E1 during disruption Phantom 4.2 camera @ 1 msec exposure
Correlation of BEaP Probes with GPI • Fluctuations highly correlated between GPI and probes • GPI well aligned along field line with probes (~ like EFIT) P1 P2 P3 P4 P5 #126663 probe number time (msec) 194 198 202 206 210 214
Effect of Bias on GPI and Electrodes ± 90 V 0 V ± 90 V 0 V • Turbulence motion seems to be affected by biasing • Small ‘spots’ are correlated with arcing at - electrode
Experiments for 2008 • Continue to ‘piggy back’ electrode bias when possible • Do XP 806 when possible including: - Ohmic plasmas with smaller outer gap - Systematic bias scan with NBI plasma - Try biasing with ‘floating double probe’ • Attempt detailed comparison with theory and simulation • Design biasing scheme for divertor plates (if warranted)