Download
1 / 20
210 likes | 502 Views
Software Engineering. Lecture 4 Software Metrics. Why do we Measure?. To characterize To evaluate To predict To improve. A Good Manager Measures. process. process metrics. project metrics. measurement. product metrics. product. What do we. use as a. basis?. • size?.

E N D
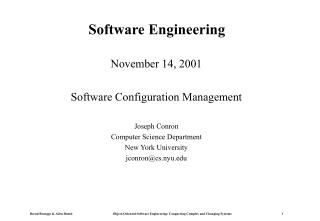
Software Engineering Lecture 4 Software Metrics
Why do we Measure? • To characterize • To evaluate • To predict • To improve
A Good Manager Measures process process metrics project metrics measurement product metrics product What do we use as a basis? • size? • function?
Process Metrics • majority focus on quality achieved as a consequence of a repeatable or managed process • statistical SQA data • error categorization & analysis • defect removal efficiency • propagation from phase to phase • reuse data
Project Metrics • Effort/time per SE task • Errors uncovered per review hour • Scheduled vs. actual milestone dates • Changes (number) and their characteristics • Distribution of effort on SE tasks
Product Metrics • focus on the quality of deliverables • measures of analysis model • complexity of the design • internal algorithmic complexity • architectural complexity • data flow complexity • code measures (e.g., Halstead) • measures of process effectiveness • e.g., defect removal efficiency
Metrics Guidelines • Use common sense and organizational sensitivity when interpreting metrics data. • Provide regular feedback to the individuals and teams who have worked to collect measures and metrics. • Don’t use metrics to appraise individuals. • Work with practitioners and teams to set clear goals and metrics that will be used to achieve them. • Never use metrics to threaten individuals or teams. • Metrics data that indicate a problem area should not be considered “negative.” These data are merely an indicator for process improvement. • Don’t obsess on a single metric to the exclusion of other important metrics.
Normalization for Metrics Normalized data are used to evaluate the process and the product (but never individual people) size-oriented normalization — the line of code approach function-oriented normalization — the function point approach
Typical Size-Oriented Metrics • errors per KLOC (thousand lines of code) • defects per KLOC • $ per LOC • page of documentation per KLOC • errors / person-month • LOC per person-month • $ / page of documentation
The LOC-based Estimation (p. 128) • Determining the major software functions • Develop an estimation table based on historical data • An Example:Estimated lines of code (total): 33,200 LOCAverage productivity: 620 LOC / pmLabor rate: $8000 per monthCost per LOC: $13 (8000 / 620)Total estimated project cost: $431,000 (13 x 33200)Estimated effort: 54 pm (33200 / 620)
Typical Function-Oriented Metrics • errors per FP (thousand lines of code) • defects per FP • $ per FP • pages of documentation per FP • FP per person-month
independent of programming language uses readily countable characteristics of the "information domain" of the problem does not "penalize" inventive implementations that require fewer LOC than others makes it easier to accommodate reuse and the trend toward object-oriented approaches Why Opt for FP Measures?
Analyze information Establish count for input domain and domain of the system interfaces application and develop counts Assign level of complexity or weight Weight each count by assessing complexity to each count Assess influence of Grade significance of external factors, F i global factors that affect such as reuse, concurrency, OS, ... the application function points = (count x weight) x C Compute where: function points complexity multiplier: C = (0.65 + 0.01 x N) degree of influence: N = F i Computing Function Points
Analyzing the Information Domain weighting factor count simple avg. complex measurement parameter number of user inputs X 3 4 6 = number of user outputs X 4 5 7 = number of user inquiries X 3 4 6 = number of files X 7 10 15 = number of ext.interfaces X 5 7 10 = count-total complexity multiplier function points
Taking Complexity into Account Factors are rated on a scale of 0 (not important) to 5 (very important): on-line update data communications complex processing distributed functions installation ease heavily used configuration operational ease transaction rate multiple sites on-line data entry facilitate change end user efficiency
FP-based Estimation (p. 129) • Estimating the information domain values (input, output, inquiries, files, external interfaces), calculating the count-total • Calculating the complexity adjustment factor(0.65 + 0.01 x S Fi) • FP estimated = count-total x complexity adjustment factor. • An Example:Estimated FP (total): 375 FPAverage productivity: 6.5 FP / pmLabor rate: $8000 per monthCost per FP: $1230 (8000 / 6.5)Total estimated project cost: $461,000 (375 x 1230)Estimated effort: 58 pm (375 / 6.5)
Measuring Quality • Correctness — the degree to which a program operates according to specification • Maintainability—the degree to which a program is amenable to change • Integrity—the degree to which a program is impervious to outside attack • Usability—the degree to which a program is easy to use
Defect Removal Efficiency DRE = (errors) / (errors + defects) where errors = problems found before release defects = problems found after release
Summary • Measurement enables managers and practitioners to improve the software process; assist in the planning, tracking, and control of a software project; and assess the quality of the product (software) that is produced. • Both size and function oriented metrics are used throughout the industry. • Size oriented metrics use the LOC. • Function oriented metrics use the information domain and a subjective assessment of problem complexity.
References • Pressman, Chapter 4