Download
1 / 32
320 likes | 438 Views
Delyth Chambers. Teachers and Advisors Conference 23 May 2014 Setting the agenda for the students of the future. The changing world of HE What students are telling us they want What factors students take into account when choosing How will admissions work in 2014

E N D
Delyth Chambers Teachers and Advisors Conference 23 May 2014 Setting the agenda for the students of the future
The changing world of HE • What students are telling us they want • What factors students take into account when choosing • How will admissions work in 2014 • How will it change in 2015 and beyond? • Brief overview of national employment trends • Our Warwick journeys 2
The world has changed.. • Mass global higher education system • Vast amount of choice • Higher Education at whim of governments: funding, regulation • Higher participation across all social groups • HE in FE • Private providers • Technology and mobile communication 3
The world has changed.. Bristol 1909 4
The world has changed.. …Warwick 1970s 5
The changing higher education landscape • 1951:12 universities • 1969:33 universities including OU • 1969-1991: 33 universities, 33 polytechnics • 1992: University status awarded to polytechnics • 2005: 167 universities and colleges of higher education • 2014:> 300 institutions in UCAS scheme admitting full time undergraduate students
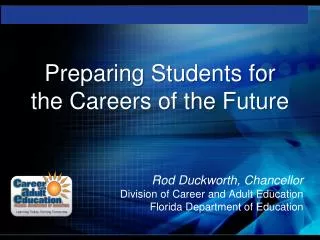
50 years of applications: UCCA and UCAS Source: UCAS Statistics
Qualifications on entry • 1960s • A-levels • 2000s • A-levels • BTEC • International Baccalaureate • Cambridge Pre-U • NVQs • AQA Bacc
HE today • Mix of institutions offering HE level study: • Universities • University colleges • Colleges of higher education • HE provision in FE colleges • Bachelor Degrees, Foundation Degrees • Only half of entrants are school leavers • 2.5 million students (more women than men) • > 400,000 from overseas • ‘Mission Groups’ – Russell Group, 1994 Group, Million +, Non-Aligned, 157 Group
HE today: Current pressures • Larger class sizes • Financial pressures • Reliance on overseas student income • Research, services to business • Skills of incoming students • Ageing workforce • Widening participation agenda • Growing importance of the student experience
HE today‘The student experience’ • Student as consumer: ‘paying customer’ • Employability • Emphasis on study skills • Independent learning • Methods of delivery of teaching • Facilities and lifestyle choices
What do students want? In some areas, the Student Academic Experience Survey has shown only modest changes since it began in 2006, but students in England are paying much more for their education and this is having an impact on their perceptions. They are paying a lot more, receiving a little more and increasing their expectations in terms of value for money. The survey has also shown persistent issues across the UK on contact hours and class sizes, as well as the comparability of degrees. HEPI Student Academic Experience Survey, May 2014 14
CURRENT ISSUES IN ADMISSIONS 2014 • Changes in patterns of demand • Student Number Control cap still exists – limits the number of places for students with less than ABB (or equivalent) • Students (and parents) as consumers • Changing methods of communications • Reduction in government funding allocations 21
National application picture: biggest increases in demand since 2013 23
Young People (16-24) methods of communication in 2012 (2013, YouthSight) 24
Warwick admissions 2014 ~30,000 total applications (+8% on 2013) ~ 18,000 Home/EU ~ 8,000 Overseas Conditional offers: ~12,500 Home/EU ~ 5,500 Overseas Intake target: ~3,200 Home/EU ~ 850 Overseas 25
…beyond 2015 • August 2015 – no cap on numbers • Increased competition and marketisation of the sector • Different practices some universities eg making unconditional offers • Warwick: IGGY • General election 2015 – fees reductions? Institution funding? • Demographics • Qualification changes • Changing patterns of student choice of sixth form subjects • Differences between education in UK administrations • Changes in shape of the sector – mergers, closures, private providers?? • Future demand for postgraduate courses 26
Progressing beyond university: Brief overview of graduate career trends Anne Wilson, Head of Careers, Careers and Skills
National picture (from HECSU) Overview of 2013 destinations data (6 months after graduation) Of the 242,285 graduates who responded to the survey: Average salaries of graduates employed full-time in the UK ranged from £18,345 to £22,535, depending on their occupation.
EMPLOYMENT MARKET TRENDS Graduate vacancy projections: up 10.2% compared to 2012-13 Source: AGR
Examples of starting salaries by career area in 2011-2012 Source: AGR
How recruiters select: • Degree classification is used as a screening tool by a high proportion of AGR employers (82.1%) when recruiting graduates. • The majority (81.3%) use the 2:1 as a cut off for most of their positions, 15.0% use a 2:2 and a small minority (3.8%) state that it varies by role. • There are a range of other graduate employers including SME’s for whom this is not such a significant factor