1 / 28

U.S. New Home Sales

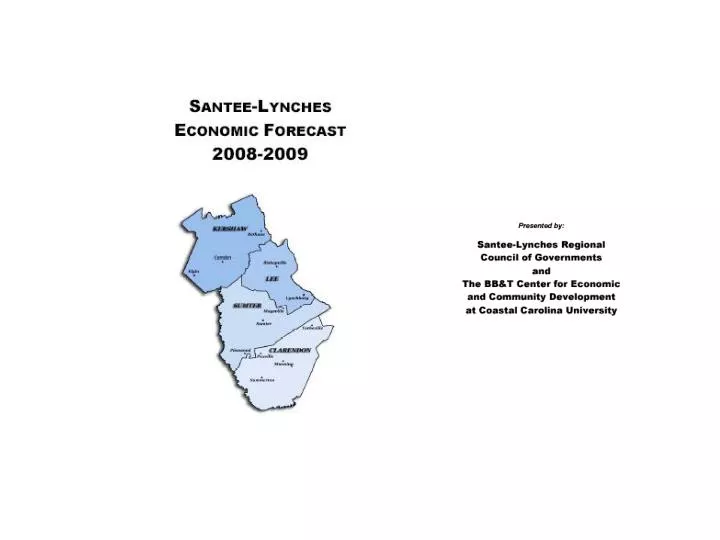
U.S. New Home Sales. S.C. Home Sales and Prices. Sales and Prices Across South Carolina, 2007 vs. 2006. S.C. and U.S. Labor Markets: Job Growth. Region’s Gross Retail Sales ($ billions). Region’s Labor Force (thousands). Region’s Total Employment (thousands). REGION LABOR FORCE.

cain-gibson
Download Presentation

U.S. New Home Sales

An Image/Link below is provided (as is) to download presentation Download Policy: Content on the Website is provided to you AS IS for your information and personal use and may not be sold / licensed / shared on other websites without getting consent from its author. Content is provided to you AS IS for your information and personal use only. Download presentation by click this link. While downloading, if for some reason you are not able to download a presentation, the publisher may have deleted the file from their server. During download, if you can't get a presentation, the file might be deleted by the publisher.

E N D

Presentation Transcript


  1. U.S. New Home Sales

  2. S.C. Home Sales and Prices

  3. Sales and Prices Across South Carolina, 2007 vs. 2006

  4. S.C. and U.S. Labor Markets: Job Growth

  5. Region’s Gross Retail Sales($ billions)

  6. Region’s Labor Force(thousands)

  7. Region’s Total Employment(thousands)

  8. REGION LABOR FORCE Changes in 2007 Employed+ Unemployed = Labor Force (-387)(-809)-1,196 2007 96,680 Labor Force 7.0% unemployed 93.0% employed Unemployment = Unemployed Rate Employed + Unemployed 2006 97,876 Labor Force 7.8% unemployed 92.2% employed

  9. Historical Unemployment Rates

  10. Region’s Unemployment Rate(percent)

  11. -6,420 manufacturing job losses from 2000-Mid ‘07 for region. Source: Quarterly Census of Employment and Wages (QCEW)

  12. +1,791 non-manufacturing job gains from 2000-Mid ‘07 for region. Source: Quarterly Census of Employment and Wages (QCEW)

  13. Public high school graduation rates in region Whole body of 8th graders through the years 65% are graduating high school with a diploma over time in region. High School Years • Current region average of 65% is about equal to state average. • U.S. average is about 72% in recent years. Source: S.C. Department of Education enrollment and diploma data

  14. Increase:U.S. 15.8% S.C. 18.3% Region: 10.1% Source: U.S. Census Bureau

  15. Increase:U.S. 20.2% S.C. 22.9% Region: 13.2% Source: U.S. Census Bureau

  16. $ Increase% Increase U.S. +$11,395 49.4% S.C. +$9,161 47.9% Region +$8,901 55.5%

  17. Single Family Building Permits(# of permits)

  18. Single Family Permits Value($millions)

  19. Manufactured/Mobile Home Permits(# of permits)

  20. Nonresidential Building Permits(# of permits)

  21. Nonresidential Permit Value($millions)

  22. GDP Growth Rate(percent)

  23. CPI Inflation Rate(percent)

  24. Prime Rate(percent)

  25. 30-Year Conventional Mortgage Rate(percent)

  26. 3-Month Treasury Rate(percent)

  27. 10-Year Treasury Rate(percent)

More Related