Download
1 / 29
320 likes | 793 Views
Chapter 7: Failure Prediction for Cyclic and Impact Loading. All machines and structural designs are problems in fatigue because the forces of Nature are always at work and each object must respond in some fashion. Carl Osgood, Fatigue Design.

E N D
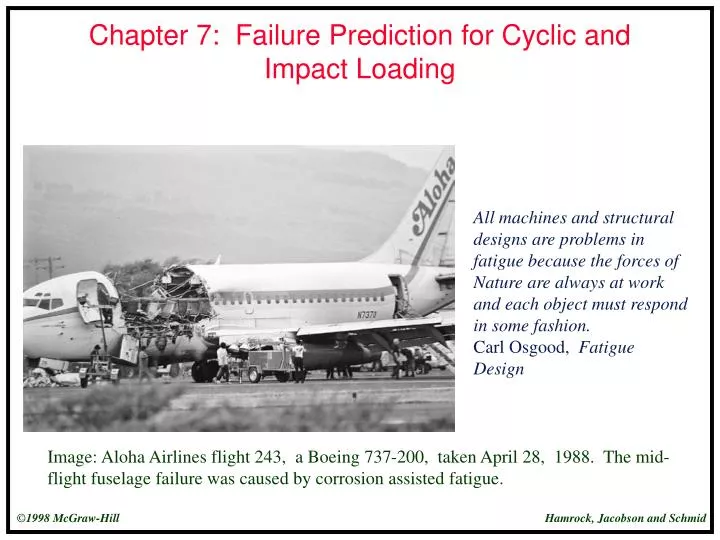
Chapter 7: Failure Prediction for Cyclic and Impact Loading All machines and structural designs are problems in fatigue because the forces of Nature are always at work and each object must respond in some fashion. Carl Osgood, Fatigue Design Image: Aloha Airlines flight 243, a Boeing 737-200, taken April 28, 1988. The mid-flight fuselage failure was caused by corrosion assisted fatigue.
On the Bridge! Figure 7.1 “On the Bridge,” an illustration from Punch magazine in 1891 warning the populace that death was waiting for them on the next bridge. Note the cracks in the iron bridge. [From Petroski (1992).]
Cyclic Stress Figure 7.2 Variation in nonzero cyclic mean stress. Text Reference: Figure 7.2, page 261
Cyclic Properties of Some Metals Table 7.1 Cyclic properties of some metals [From Shigley and Mischke (1989) and Suresh (1991)] Text Reference: Table 7.1, page 263
R.R. Moore Specimen Figure 7.3 R.R. Moore machine fatigue test specimen. Text Reference: Figure 7.3, page 264
Fatigue Strength vs. Cycles to Failure Figure 7.4 Fatigue strengths as a function of number of loading cycles. Ferrous alloys, showing clear endurance limit. Text Reference: Figure 7.4, page 266
Fatigue Strength vs. Cycles to Failure (cont.) Figure 7.4 Fatigue strengths as a function of number of loading cycles. Aluminum alloys, with less pronounced knee and no endurance limit. Text Reference: Figure 7.4, page 266
Fatigue Strength vs. Cycles to Failure (cont.) Figure 7.4 Fatigue strengths as a function of number of loading cycles. (c) Selected properties of assorted polymer classes. Text Reference: Figure 7.4, page 266
Endurance Limit vs. Ultimate Strength Figure 7.5 Endurance limit as a function of ultimate strength for wrought steels. Text Reference: Figure 7.5, page 267
Approximate Endurance Limit for Various Materials Table 7.2 Approximate endurance limit for various materials [From Juvinall and Marshek (1991)]. Text Reference: Table 7.2, page 267
Notch Sensitivity Figure 7.6 Notch sensitivity as a function of notch radius for several materials and types of loading. [From Sines and Waisman (1959)]. Text Reference: Figure 7.6, page 272
Surface Finish Factors Figure 7.7 Surface finish factors for steel Function of ultimate strength in tension for different machine processes. [From Shigley and Mitchell (1983).] Text Reference: Figure 7.7, page 273
Surface Finish Factors (cont.) Figure 7.7 Surface finish factors for steel (b) Function of ultimate strength and surface roughness as measured with a stylus profilometer. [From Johnson (1967).] Text Reference: Figure 7.7, page 274
Surface Finish Factor Table 7.3 Surface finish factor [From Shigley and Mischke (1989)]. Usage: kf=e(Sut)f (ref: Eq. 7.21) Text Reference: Table 7.3, page 274
Reliability Correction Factors Table 7.4 Reliability correction factors for six probabilities of survival. Text Reference: Table 7.4, page 275
Example 7.4 Figure 7.8 Tensile-loaded bar. (a) Unnotched; (b) notched. Text Reference: Figure 7.8, page 277
Influence of Non-Zero Mean Stress Figure 7.9 Influence of nonzero mean stress on fatigue life for tensile loading as estimated by four empirical relationships. Text Reference: Figure 7.9, page 280
Modified Goodman Diagram Figure 7.10 Complete modified Goodman diagram, plotting stress as ordinate and mean stress as abscissa. Text Reference: Figure 7.10, page 283
Example 7.7 Figure 7.11 Modified Goodman diagram for Example 7.7. Text Reference: Figure 7.11, page 285
Alternating Stress Ratio vs. Mean Stress Ratio Figure 7.12 Alternating stress ratio as a function of mean stress ratio for axially loaded cast iron. Text Reference: Figure 7.12, page 287
Correction Factor Y Figure 7.13 Correction factor Y to compensate for plate width in fracture mechanics approach to fatigue crack propogation. [From Suresh (1991).] Text Reference: Figure 7.13, page 289
Properties vs. Strain Rate Figure 7.14 Mechanical properties of mild steel at room temperature as a function of average strain rate. [From Manjoine (1994).] Text Reference: Figure 7.14, page 291
Example 7.10 Figure 7.15 Diver impacting diving board, used in Example 7.10. (a) Side view; (b) front view; (c) side view showing forces and coordinates. Text Reference: Figure 7.15, page 293
Brake Stud Figure 7.16 Dimensions of existing brake stud design. Note that no radius has been specified at point A-A. Text Reference: Figure 7.16, page 296
Applied Loads and Resultant Stress Cycle Figure 7.17 Press brake loads. (a) Shear and bending moment diagram for applied load; (b) stress cycle.
Daño Acumulativo Regla de Daño lineal o de Palgrem Miner Se predice la falla cuando la fracción de daño por niveles diferentes de esfuerzo excede la unidad. El nivel de daño es directamente proporcional al número de ciclos, donde no importa la secuencia de los mismos.
Daño Acumulativo Para la barra sin muesca, el esfuerzo de fatiga se refleja en la siguiente tabla: Hallar el número de ciclos hasta la falla acumulativa
Daño Acumulativo Para la barra sin muesca, el esfuerzo de fatiga se refleja en la siguiente tabla: