Download

1 / 49
490 likes | 604 Views
Clouds and Climate Through a Soda Straw. Mark Miller. Earth’s Radiation 288 K. Sun’s Radiation 6000 K. Quantity of Radiation. Visible. Infrared. 3. 10. 0.5. Wavelength (micrometers). Visible Satellite Photo. Infrared Satellite Image. Source: NASA/ Earth Radiation Budget Experiment.

E N D
Clouds and Climate Through a Soda Straw Mark Miller
Earth’s Radiation 288 K Sun’s Radiation 6000 K Quantity of Radiation Visible Infrared 3 10 0.5 Wavelength (micrometers)
“The study of climate and climate change is hindered by a lack of information on the effect of clouds on the radiation balance of earth.” • Ramanathan et al., 1989: Science, 243, 57-62.
Figure 2.10 • IPCC Working Group I (2007)
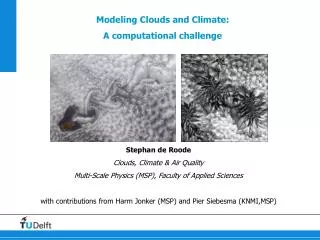
Representing Clouds in Climate Models CLIMATE MODEL GRID CELL 60-N Weather Forecast Model Grid Cell Cloud Resolving Models: Less Than Width Of Lines 55-N 172-W 157-W
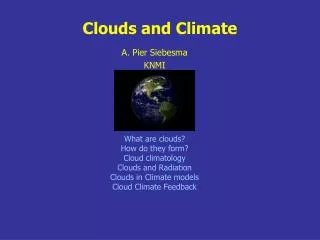
What Cloud Properties Change the Net Radiation Received at the Surface? • Amount of the sky that is covered • Thickness • Composition • Contain ice crystals, liquid water, or both? • Particle sizes? • Particle concentrations? • Height in the atmosphere
How Does the Location of Cloud Impact the Surface Temperature? Space High Clouds ~10-km Low Clouds ~2-km COOLING WARMING
What We Know About Solar Radiation and Clouds • Solid theoretical foundation for interaction between a single, spherical liquid cloud droplet and sunlight • Cloud Droplet • Sun • Scattered • Light
What We Know About Solar Radiation and Clouds • Some theoretical foundation for interaction of sunlight and simple ice crystal shapes
What We Wish We Knew About Solar Radiation and Clouds • How do we compute the total impact of a huge collection of diverse individual cloud particles? • What are the regional differences in cloud composition, coverage, thickness, and location in the atmosphere? • If we knew (1) and (2), how do we summarize all of this information so that it can be incorporated into a climate model?
What We Know About Outgoing Terrestrial Radiation and Clouds • Good theoretical foundation for interaction of terrestrial radiation and cloud water content (liquid clouds). • Particle: • radius somewhat important in thin liquid clouds • shape and size somewhat important in high level ice clouds (cirrus) • Aerosols?
2-km CloudsThrough a SODASTRAW! Meteorological Tower Multiple Radars Calibration Facility Multiple Lidars Surface Radiation
SGP Central Facility SODA STRAW Extended Measurement Facilities Wichita Oklahoma City
What types of remote sensors do we use to make cloud measurements? • Visible and Infrared Sky Imagers • Vertically-Pointing Lasers (LIDARs) • Measure the height of the lowest cloud base • Below cloud concentrations of aerosol and water vapor • Beam quickly disperses inside cloud • Cloud Radars • Information about cloud location and composition • Microwave Radiometers • Measure the total amount of liquid water in atmosphere • Can’t determine location of liquid • Presently not measuring total ice content
Visual Images of the Sky • cloud coverage (versus cloud fraction) • simple! digitize images and … • daytime only • integrated quantity
…have been for the birds! 3/20/08 3/21/08 3/22/08 3/23/08
Sky Imaging • 500 nm • RV Ron Brown • Central Pacific • AOT=0.08 • AMF • Niamey, Niger • AOT=2.5-3 • Sea of Japan • AOT=0.98
Laser Data from Southern Great Plains 20-km No Signal 10-km Low Clouds Ice Clouds Surface time 7:00 pm 7:00 am 24 Hours 7:00 pm Negligible Return Cloud and Aerosol Particles Cloud droplets
Niamey, Niger, Africa • 20 Cloud Droplets • 15 Cloud and/or Aerosol Height (km) • 10 • LIQUID CLOUDS • 5 • Biomass Burning • Dust Negligible Return • 0 • 1200 • 0000 • 0000 Time (UTC)
Cloud Dust Lake Chad • Dust product (upper) and GERB OLR (lower) for 1200UT on 8 March 2006
At a Given Wavelength A Cloud Particle At Different Wavelengths Energy Returned to Radar Energy Returned to Radar radius6 wavelength-4 Size of Cloud Particle Radar Wavelength
94 GHz 35 GHz Maximum Propagation Distance Energy Absorbed by Atmosphere 10-15 km 20-30 km 3.2 mm 8 mm Radar Wavelength
Cloud Radar Data from Southern Great Plains 20-km Black Dots: Laser Measurements Of Cloud Base Height 10-km Surface time 7:00 pm 7:00 am 7:00 pm Small Cloud Particles Typical Cloud Particles Very Light Precipitation
Cloud Radar Data from Southern Great Plains 20-km Black Dots: Laser Measurements Of Cloud Base Height 10-km Insects Thin Clouds Surface time 7:00 pm 7:00 am 7:00 pm Small Cloud Particles Typical Cloud Particles Very Light Precipitation
Top Radar Echo Low Radar Sensitivity 10-km Base Radar Echo Top Base 2-km Emission Radar Echo Surface Microwave Radiometer Laser Radar
Evolution of Cloud Radar Science • Cloud Structure and Processes • Cloud Statistics • Cloud Composition
Cloud Transition Azores Applications of Surface-Based Cloud Observing Systems Example: Marine Cloud Transitions Solid Overcast Broken Cloud
Application of Surface-Based Remote Sensing to a Cloud “Problem” • Marine Stratocumulus Transition
THEORY Mid-latitudes Tropics 2 km 0.5 km Ocean Surface OBSERVED Mid-latitudes Tropics 2 km 0.5 km Ocean Surface
Tropical Western Pacific Jan 1999 June 1999 15-km 10-km 5-km Cloud Top Height 3% 1% 3% 10% 1% 10% Probability Probability
Retrieving Liquid Cloud Composition Mode Radius?? Height Width Mode Radius = + Number + Height Particle Size Height Radar Echo Intensity Number Concentration?? Number Concentration Total Liquid Water (Microwave Radiometer)
Liquid Cloud Particle Mode Radius 6 4 Height (km) 2 0 time 7:00 pm 7:00 am 7:00 pm 25 17 1 4 10 Micrometers
Active and Passive Cloud Remote Sensors (cont.) • Wind Profiler • 75-m, 6-min resolution • 915 MHz [1270-1400 MHz COPS] • Minimum Height: 120-m • Maximum height: 5.5-km • Atmospheric Emitted Radiance Interferometer (AERI) • 3-19.2 mm (1 cm-1 resolution) • 6-min resolution (20-30 sec possible for COPS) • 1.3 degree field-of-view
Analysis of the Impact of Clouds on Radiation Remotely-Sensed Information about Cloud Structure and Composition Existing Theoretical Models of Radiation Transfer Through Clouds Compute the Energy Budgets at the Surface and Top-of-Atmosphere Compare with Coincident Measurements of the Energy Budget
Meteorological Models • Global Climate Model (GCM) • Forecast Period: Decades to Centuries • Resolution: ~300-km x 300-km • Crude Representations of Many Processes • Numerical Weather Prediction Model (NWP) • Forecast Period: Hours to a Few Days • Resolution: 29-km x 29-km • Better Representations of Many Processes • Cloud Resolving Model (CRM) • Forecast Period: Hours • Resolution: 1-km x 1-km • Detailed Representations of Processes
Super-Parameterizations: The Grabowski, Randall, and Arakawa Scheme CLIMATE MODEL GRID CELL 60-N 5-10 years? 2-Dimensional Cloud Resoving Model 3-D Simulation 55-N 172-W 157-W
Summary • Collecting and analyzing large data sets to better understand cloud behavior • Observations are more compatible with evaluation of cloud resolving models than current GCMs • New “super-parameterizations” in GCMs appears to be the path forward: 5-10 years • Based on cloud resolving models