Download
1 / 10
100 likes | 233 Views
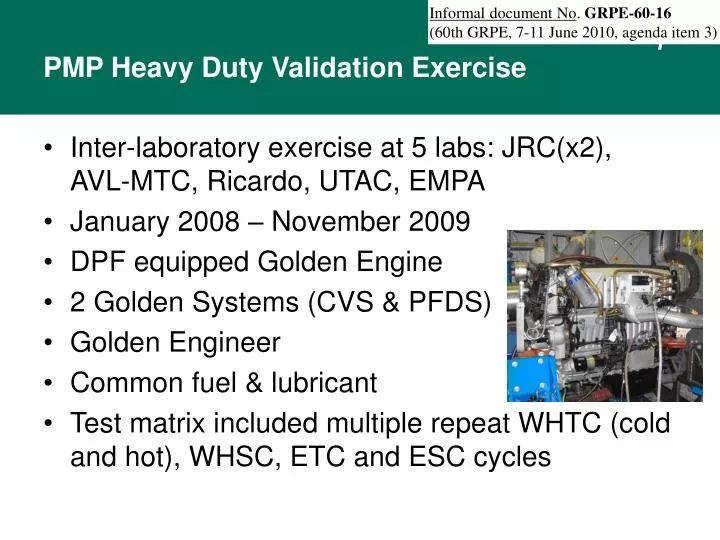
Informal document No . GRPE-60-16 (60th GRPE, 7-11 June 2010, agenda item 3). PMP Heavy Duty Validation Exercise. Inter-laboratory exercise at 5 labs: JRC(x2), AVL-MTC, Ricardo, UTAC, EMPA January 2008 – November 2009 DPF equipped Golden Engine 2 Golden Systems (CVS & PFDS) Golden Engineer

E N D
Informal document No. GRPE-60-16 (60th GRPE, 7-11 June 2010, agenda item 3) PMP Heavy Duty Validation Exercise • Inter-laboratory exercise at 5 labs: JRC(x2), AVL-MTC, Ricardo, UTAC, EMPA • January 2008 – November 2009 • DPF equipped Golden Engine • 2 Golden Systems (CVS & PFDS) • Golden Engineer • Common fuel & lubricant • Test matrix included multiple repeat WHTC (cold and hot), WHSC, ETC and ESC cycles
PM Observations • Generally well below 10mg/kWh • Minimal cycle dependency • Some high results due to high tunnel background contribution
PN Emissions Levels • Highest emissions highest over cold start cycle • High temperature operation in WHSC and ESC showed some increased emissions due to passive regeneration
PN Repeatability • c.20% WHTCcold, 50% WHTChot, c.20% WHTCcombined, 60-70% WHSC • Similar repeatability CVS and PFS
PN Reproducibility • 30-50% WHTCcold, 50-80% WHTChot, c.50% WHTCcombined, c.80% WHSC
Dilution System Background Influence • In some labs’ CVS dilution systems, background levels were significant over low emission cycles
WHSC Passive Regeneration Impacts • ~65% of cycle in temperature window in which passive regeneration can occur • Increased emissions and variability
Agreement of Different PN Measurement Systems • Calibrated systems generally agreed well with Golden System • High system background on some uncalibrated systems gave higher offsets at lower emissions levels
Conclusions • PN Measurement System performed reliably with no significant failures • PN emission levels over cold WHTC were ~4×10¹¹ #/kWh. At these emission levels, dilution system background is insignificant. • PN emission levels over hot start WHTC and ETC cycles were <2×10¹⁰ #/kWh. • Passive regeneration occurring over the WHSC and ESC cycles results in an increase of the emissions, up to 6×10¹⁰ #/kWh, and in variability due to influence of initial DPF fill state • Background in some labs CVS dilution systems was a substantial influence on their hot start cycle results • Alternative systems correlated closely with the GPMS • Repeatability and reproducibility levels were similar for Full and Partial Flow Dilution Systems, ranging from: • ~20% and ~40%, respectively, over cold WHTC ; to • ~70% and ~80%, respectively, over WHSC, due to passive regeneration related effects
Recommendations • Labs should monitor and manage tunnel background e.g. via use and cleaning of PFDS, test scheduling, tunnel pre-conditioning • Higher variability on WHSC (due to passive regeneration) needs to be allowed for in setting of PN limit values • PN sample flow extraction should be corrected for in PFDS control & PM measurement (total sampling type)