Download
1 / 40
400 likes | 561 Views
Department of Ecology Water Quality Standards Human Health Criteria Implementation Tools. Lake Roosevelt Forum Conference November 20, 2013. Regulatory Landscape for Water Quality Standards. Federal Clean Water Act (CWA) dictates all states must develop water quality standards.

E N D
Department of Ecology Water Quality StandardsHuman Health Criteria Implementation Tools Lake Roosevelt Forum Conference November 20, 2013
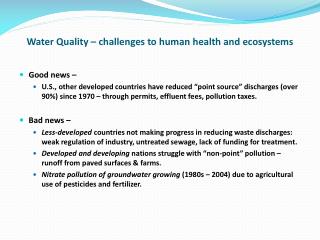
Regulatory Landscape for Water Quality Standards • Federal Clean Water Act (CWA) dictates all states must develop water quality standards. • Submitted to the Environmental Protection Agency for review and approval (or disapproval). • The EPA is required to promulgate water quality standards for states that do not adopt standards.
Timeline for Washington Water Quality Standards Rule Making Final Rule (CR-103) filed. Planned in 2014. Rule becomes effective 30 days after filing October 25, 2011 CR-101 filed to update implementation tools in Water Quality Standards for Surface Waters of the State of Washington Proposed draft rule (CR-102) published. Early 2014 September 13, 2012 CR-101 for the Human Health Criteria rulemaking filed and CR-101 for implementation tools re-filed to be concurrent with HHC rulemaking. Proposed draft rule Comment Period State Economists require 6 weeks prior to CR-102 filing for review and analysis Rulemaking Nov. 6 Public meeting to share pre-decisional rule options CR-103 must be filed no more than 180 days after the publication of the CR-102 Pre-proposal rule making process–comments from stakeholders to Ecology throughout the process Input into draft rulemaking from Policy Forums, Delegates’ Table, and Governor’s Group October 29, 2012 First Policy Forum and Delegates’ Table meeting June 24 Delegates’ Table #2 Aug. 1 Delegates’ Table #3 Sept. 16 Delegates’ Table #4 Oct. 9 Delegates’ Table #5 Nov. 25 Delegates’ Table #6 Dec. TBD Delegates’ Table #7 Jan. TBD Delegates’ Table #8 Delegates’ Table and Policy Forum Sep. 12 Policy Forum #7 Dec. 10 Policy Forum #2 Feb. 8 Policy Forum #3 Mar. 28 Policy Forum #4 May 23 Policy Forum #5 Leadership Oversight Group (EPA, Tribes, and Ecology) EPA reviews and makes a determination on WA adopted Water Quality Standards AFTER ECOLOGY FILES THE CR-103 Dec. 12 2013 Meeting May 2012 Meeting April 2013 Meeting Nov. 2012 Meeting Provide guidance, focus and coordination in the continued development of the FCR and WQS July 11 Policy Forum #6 Governor Inslee initiates his informal advisory group (GIAG) WA Governor’s Office Feb2014 April2014 June2014 August2014 June2013 Feb2013 April2013 August2013 October2013 December2013 2012 2013 2014 Oct. 4 GIAG #1 Nov. 8 GIAG #2 Dec. 5 GIAG #3 Jan. 9 GIAG #4
Example Equation Used to Develop Human Health Criteria • Risk Level: risk of additional cancer occurrence. • Current risk level = risk of one additional • occurrence of cancer in one million people. • The risk level will be reviewed during the rule. * Organism only equations (marine water criteria) Carcinogens RL x BW Body weight: adult = 70 kg = 154 lbs * HHC = CSF x FCR x BCF Bioconcentration Factor: describes the amount of pollutant in the water compared to the amount in the fish tissue. EPA provides this number . Fish Consumption Rate: the consumption rate that the risk level is tied to. Cancer Slope Factor: a measure of the how strong a carcinogen a chemical is. EPA sets this number.
Risk Level 10-6 - means there is a risk of one additional occurrence of cancer, in one million people, at the given exposure assumptions (this is compared to an unexposed population). Increasing protection
Fish Consumption Rate Considerations • What group of fish consumers to protect? • Per Capita (everyone = consumers & non-consumers) • Consumers only • What population to apply protection the level to? • General population • Highly exposed population • What data to use? • National data • Local data (Washington) • How salmon are addressed? • Not included • Apportioned? • 100% included
Carcinogens 6.5 125 175 225 Organisms Only (Marine Criteria)
6.5 125 175 225 Fish ConsumptionRates (gramsper day)
Why Develop New Implementation Tools? • May take a long time to achieve some new standards. • Need a compliance pathway for dischargers that are doing all the actions possible to remove toxics but cannot get there. • Technology capability • Non-permitted sources are a significant part of the problem. We need tools to address unpermitted sources.
Permit Specific Challenges • Current tools are limited to 5 and 10-year time frames. • Some situations will need more than 10 years to attain compliance with WQS. • Would like to encourage toxic reduction activities versus the other option of changing a use on the waterbody – giving up.
Tools to Help With Implementation • Ecology already has a number of tools that we use when issuing permits (e.g. mixing zones). • We are looking at expanding those tools: • Language around intake credits • Additional language around compliance schedules • Variances
Intake Credits • Accounts for pollutants already present in intake water. • When the mass and concentration of effluent is the same or less than intake water. • “No net addition” of the pollutant. • Add language to Water Quality Standards to clarify conditions allowing intake credits to be used for water quality-based effluent limits (similar to Oregon and Great Lakes Initiative).
Compliance Schedules • Applies to existing discharges. • Up to 10 years if needed. • Requires final limits based on WQ criteria and interim limits that are either numeric or non-numeric (e.g., construction of facilities by a specific date; source identification and controls by specific dates).
Compliance Schedule Rule Alternatives • Option 1 – Delete the 10 year time limit. Require shortest timeframe possible on a case specific basis. • Option 2 – Add language to allow 20 year compliance schedule for facilities where there has been a TMDL to address a specific pollutant (2010 legislative language). • Option 3 - Add language to provide 20 year compliance schedule for areas that do not have a TMDL (goes beyond 2010 legislative intent).
Variance • Must meet existing federal conditions. • Temporary waiver from meeting existing water quality standards. • Currently issued for up to 5-years. May be renewed. • A variance requires a WQS rule modification and USEPA CWA review and approval (including ESA consultation for ESA-applicable rule changes).
Variances – Duration • Option 1 – Do not specify in in this implementation rule how long a variance can be in effect. This will be defined in the specific variance being proposed at a latter date. • Option 2 – Set in rule the expectation that variance could not exceed a specific time period (eg. 40 years or some other specified duration).
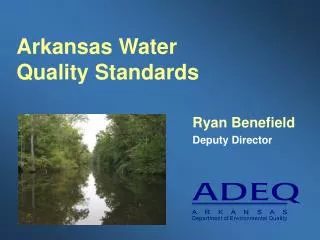
Arsenic Specific Challenges • Naturally occurring metal • We see it everywhere – but it is also a human influenced pollutant. Alternative • Look at the risk level similar to Oregon. • Consider basing criteria on Safe Drinking Water Act levels for fresh water.
PCBs Specific Challenges • Some level PCBs are present in nearly all fish we test - even in undeveloped areas. Alternatives • Look at a different risk level for PCBs. Base criteria on health effects vs. cancer effects. • Waterbody-wide variance or statewide variance (does not preclude the option of individual discharger variances) at another rule process.
Mercury Specific Challenges • Extra challenge for methyl mercury-how to translate tissue values into effluent limits. • Atmospheric deposition significant source. • Alternatives: • Move forward with mercury criteria calculated as other HHC. • Wait to adopt methyl mercury criteria. • Variances
Next Steps Draft Rule out in Winter 2014 Delegates Table Meeting on November 25th-ability to listen in to conversation More information – email: swqs.ecy.wa.gov
Timeline for Washington Water Quality Standards Rule Making Final Rule (CR-103) filed. Planned in 2014. Rule becomes effective 30 days after filing October 25, 2011 CR-101 filed to update implementation tools in Water Quality Standards for Surface Waters of the State of Washington Proposed draft rule (CR-102) published. Early 2014 September 13, 2012 CR-101 for the Human Health Criteria rulemaking filed and CR-101 for implementation tools re-filed to be concurrent with HHC rulemaking. Proposed draft rule Comment Period State Economists require 6 weeks prior to CR-102 filing for review and analysis Rulemaking Nov. 6 Public meeting to share pre-decisional rule options CR-103 must be filed no more than 180 days after the publication of the CR-102 Pre-proposal rule making process–comments from stakeholders to Ecology throughout the process Input into draft rulemaking from Policy Forums, Delegates’ Table, and Governor’s Group October 29, 2012 First Policy Forum and Delegates’ Table meeting June 24 Delegates’ Table #2 Aug. 1 Delegates’ Table #3 Sept. 16 Delegates’ Table #4 Oct. 9 Delegates’ Table #5 Nov. 25 Delegates’ Table #6 Dec. TBD Delegates’ Table #7 Jan. TBD Delegates’ Table #8 Delegates’ Table and Policy Forum Sep. 12 Policy Forum #7 Dec. 10 Policy Forum #2 Feb. 8 Policy Forum #3 Mar. 28 Policy Forum #4 May 23 Policy Forum #5 Leadership Oversight Group (EPA, Tribes, and Ecology) EPA reviews and makes a determination on WA adopted Water Quality Standards AFTER ECOLOGY FILES THE CR-103 Dec. 12 2013 Meeting May 2012 Meeting April 2013 Meeting Nov. 2012 Meeting Provide guidance, focus and coordination in the continued development of the FCR and WQS July 11 Policy Forum #6 Governor Inslee initiates his informal advisory group (GIAG) WA Governor’s Office Feb2014 April2014 June2014 August2014 June2013 Feb2013 April2013 August2013 October2013 December2013 2012 2013 2014 Oct. 4 GIAG #1 Nov. 8 GIAG #2 Dec. 5 GIAG #3 Jan. 9 GIAG #4
Distribution of PCB Sources in the Spokane River Source Spokane River PCB Source Assessment (Ecology ,2011)
Distribution of Measured PCB Sources2003-2004Source: Spokane River PCB Source Assessment (Ecology, 2011)
Relative Source Contribution CWA 20% Food 50% Drinking water 20% Dermal 10% Air 10%
Industrial Facility Scenario: Weyerhaeuser • Weyerhaeuser does not have an effluent criteria limit for any of the existing human health criteria. The Weyerhaeuser facility has three outfalls. Outfall 00C discharges to the Columbia River to a segment that has not been identified as polluted. Outfalls 003 and 004 discharge to Longview Ditches which are polluted for bacteria and dissolved oxygen. Scan results from effluent do not show an exceedance of existing criteria
Municipal Treatment Plant Scenario: Bellingham Outfall location 001 is the primary outfall and discharges to the lagoon and marine grid cell in Inner Bellingham Bay depicted in red. This location is currently listed for bacteria – there are no human health criteria exceedances. Scan results from effluent do not show an exceedance of existing human health criteria There is no effluent limit for existing human health criteria
Fish Consumers (Eat at least some fish) Non-Consumers (Do not eat fish at all)
Fish Consumers (Eat at least some fish) = General Population or Per Capita Non-Consumers (Do not eat fish at all)
Fish Consumers Only (Eat at least some fish) = Consumer Only
Subpopulation HIGH FISH CONSUMERS
Multiple Subpopulations Per Capita Study = Consumers + Non-consumers of many highly exposed populations
Multiple Subpopulations Consumer Only Study = Consumers Only of many highly exposed populations
Single Subpopulation Per Capita Study = Consumers + Non-consumers of one highly exposed population
Single Subpopulation Consumer Only Study = Consumers Only of one highly exposed population