Download
1 / 1
10 likes | 108 Views
Titan : Titan is the largest Saturn ’s satellite and it has a dense atmosfere, which interact either with corotating plasma of Saturn ( when Titan is inside the magnetosphere ), or with the solar wind ( when it is outside the magnetosphere ). Model

E N D
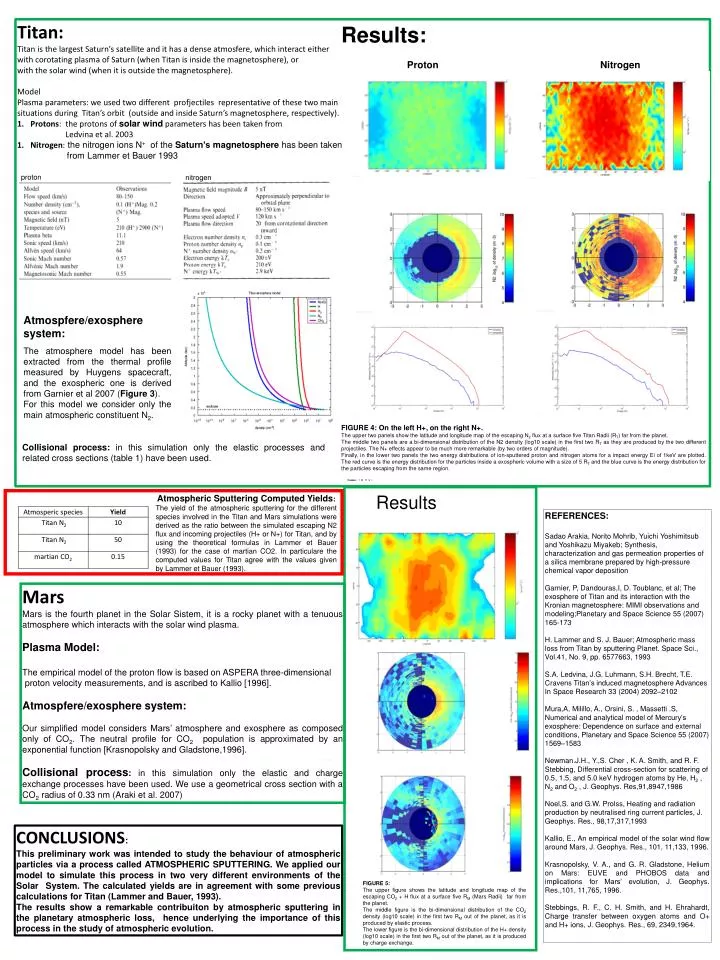
Titan: Titanis the largestSaturn’s satellite and ithas a dense atmosfere, whichinteracteither withcorotating plasma ofSaturn (whenTitanis inside the magnetosphere), or with the solarwind (whenitisoutside the magnetosphere). Model Plasma parameters: weusedtwodifferentprofjectilesrepresentativeofthesetwomain situationsduringTitan’s orbit (outside and inside Saturn’s magnetosphere, respectively). Protons: the protonsofsolarwindparametershasbeentakenfrom Ledvinaet al. 2003 Nitrogen: the nitrogenionsN+of the Saturn’s magnetospherehasbeentaken fromLammeretBauer 1993 Results: Proton Nitrogen FIGURE 4: On the left H+, on the right N+. The upper two panels show the latitude and longitude map of the escaping N2 flux at a surface five Titan Radii (RT) far from the planet. The middle two panels are a bi-dimensional distribution of the N2 density (log10 scale) in the first two RT as they are produced by the two different projectiles. The N+ effects appear to be much more remarkable (by two orders of magnitude). Finally,in the lower two panels the two energy distributions of ion-sputtered proton and nitrogen atoms for a impact energy Ei of 1keV are plotted. The red curve is the energy distribution for the particles inside a exospheric volume with a size of 5 RT and the blue curve is the energy distribution for the particles escaping from the same region. nitrogen proton Atmospfere/exosphere system: The atmosphere model has been extracted from the thermal profile measured by Huygens spacecraft, and the exospheric one is derived from Garnier et al 2007 (Figure 3). For this model we consider only the main atmospheric constituent N2. Collisional process: in this simulation only the elastic processes and related cross sections (table 1) have been used. Results Atmospheric Sputtering Computed Yields: The yield of the atmospheric sputtering for the different species involved in the Titan and Mars simulations were derived as the ratio between the simulated escaping N2 flux and incoming projectiles (H+ or N+) for Titan, and by using the theoretical formulas in Lammer et Bauer (1993) for the case of martian CO2. In particulare the computed values for Titan agree with the values given by Lammer et Bauer (1993). REFERENCES: SadaoArakia, NoritoMohrib, Yuichi Yoshimitsub and Yoshikazu Miyakeb; Synthesis, characterization and gas permeation properties of a silica membrane prepared by high-pressure chemical vapor deposition Garnier, P, Dandouras,I, D. Toublanc, et al; The exosphere of Titan and its interaction with the Kronianmagnetosphere: MIMI observations and modeling;Planetaryand Space Science 55 (2007) 165-173 H. Lammer and S. J. Bauer; Atmospheric mass loss from Titan by sputtering Planet. Space Sci., Vol.41, No. 9, pp. 6577663, 1993 S.A. Ledvina, J.G. Luhmann, S.H. Brecht, T.E. Cravens Titan’s inducedmagnetosphereAdvances InSpace Research 33 (2004) 2092–2102 Mura,A, Milillo, A., Orsini, S. , Massetti .S, Numerical and analytical model of Mercury’s exosphere: Dependence on surface and external conditions, Planetary and Space Science 55 (2007) 1569–1583 Newman.J.H., Y.,S. Cher , K. A. Smith, and R. F. Stebbing, Differential cross-section for scattering of 0.5, 1.5, and 5.0 keV hydrogen atoms by He, H2, N2and O2 , J. Geophys. Res,91,8947,1986 Noel,S. and G.W. Prolss, Heating and radiation production by neutralised ring current particles, J. Geophys. Res., 98,17,317,1993 Kallio, E., An empirical model of the solar wind flow around Mars, J. Geophys. Res., 101, 11,133, 1996. Krasnopolsky, V. A., and G. R. Gladstone, Helium on Mars: EUVE and PHOBOS data and implications for Mars’ evolution, J. Geophys. Res.,101, 11,765, 1996. Stebbings, R. F., C. H. Smith, and H. Ehrahardt, Charge transfer between oxygen atoms and O+ and H+ ions, J. Geophys. Res., 69, 2349,1964. Mars Mars is the fourth planet in the Solar Sistem, it is a rocky planet with a tenuous atmosphere which interacts with the solar wind plasma. Plasma Model: The empirical model of the proton flow is based on ASPERA three-dimensional proton velocity measurements, and is ascribed to Kallio [1996]. Atmospfere/exosphere system: Our simplified model considers Mars’ atmosphere and exosphere as composed only of CO2. The neutral profile for CO2 population is approximated by an exponential function [Krasnopolsky and Gladstone,1996]. Collisional process: in this simulation only the elastic and charge exchange processes have been used. We use a geometrical cross section with a CO2 radius of 0.33 nm (Araki et al. 2007) CONCLUSIONS: Thispreliminary work wasintendedtostudy the behaviourofatmosphericparticles via a processcalled ATMOSPHERIC SPUTTERING. Weappliedourmodelto simulate thisprocess in twoverydifferentenvironmentsof the Solar System. The calculatedyields are in agreement with some previouscalculationsforTitan (Lammer and Bauer, 1993). The results show a remarkablecontribuitonbyatmosphericsputtering in the planetaryatmospheric loss, henceunderlying the importanceofthisprocess in the studyofatmosphericevolution. FIGURE 5: The upper figure shows the latitude and longitude map of the escaping CO2 + H flux at a surface five RM (Mars Radii) far from the planet. The middle figure is the bi-dimensional distribution of the CO2 density (log10 scale) in the first two RM out of the planet, as it is produced by elastic process. The lower figure is the bi-dimensional distribution of the H+ density (log10 scale) in the first two RM out of the planet, as it is produced by charge exchange.