Download

1 / 25
260 likes | 467 Views
Chapter 3 Financial Statements. Chapter 3 Outline. 3.2 Financial Statements. Financial statements provide a summary of the transactions of a company. The balance sheet provides a snapshot of the company’s assets, liabilities, and equity at a point in time.

E N D
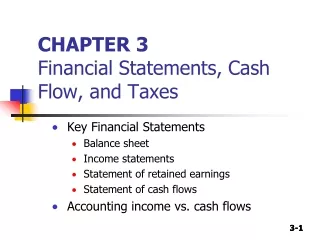
3.2 Financial Statements • Financial statements provide a summary of the transactions of a company. • The balance sheet provides a snapshot of the company’s assets, liabilities, and equity at a point in time. • The income statement and statement of cash flows summarize activity over the fiscal period, whether that be a quarter or a year. • Thestatement of cash flows provides summaries of cash flows by operations, investing, and financing activities over a period of time. • Key to understanding financial statements is appreciating that the balance sheet, income statement, and statement of cash flows are all interconnected.
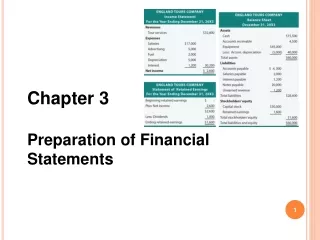
The Balance Sheet The balance sheet, which we also refer to as the statement of financial condition, is a snapshot of the company’s financial position, listing assets, liabilities, and equity. Because of double-entry bookkeeping, assets must be equal to the sum of liabilities and equity. Balance sheets are as of a particular date, such as the end of the fiscal year or fiscal quarter.
The structure of the balance sheet • The order of the assets is by liquidity, with the most liquid listed first, and so on. This is different than what we see for companies reporting based on IFRS. • According to IFRS, unless there is a compelling reason to do otherwise, the asset accounts are listed in two groups: current and noncurrent. • SAP AG, a German computer company, reports the following in its 2010 balance sheet:
The income statement The income statement, or the statement of earnings, is a summary of the company’s performance over a period of time, typically a fiscal quarter or a fiscal year. The basic structure is as follows:
Income statement: variations in terminology You will find variations of this basic structure as you examine the income statements of actual companies: • Revenues may be referred to as net revenues, sales, or net sales • The cost of goods sold may be referred to as the cost of sales or direct costs • If the company mines or extracts minerals, gas, or oil, it may have depletion, which is similar to depreciation and amortization • The company may have research and development or other operating expenses that are deducted to arrive at EBITDA • The company may have other income or other expenses that may be added or deducted before or after EBIT, depending on the nature of the income or expense • If the company has preferred stock, net income may be presented before and after preferred stock dividends are subtracted, in which case the bottom-line net income may be referred to as net income available to common shareholders
Depreciation “Wear and tear” has traditionally been referred to by accountants as depreciationbecause an asset is depreciating or reducing in value through time. The depreciation expense is the estimate of the loss of value of a long-lived tangible asset over a specified period of time, such as a year or a quarter. A similar concept is amortization, in which amortization expense is the loss of value of an intangible asset over time. For financial reporting purposes, the company is allowed to use any reasonable method for calculating depreciation or amortization.
Straight-line The most common method of depreciation for financial reporting purposes is straight-line depreciation. Depreciation using the straight-line method is the same each year of the asset’s life, calculated as the depreciable asset’s cost, less an estimated salvage value, divided by its estimated useful life:
Depreciation Example: Consider an asset that has a cost of $100,000 and a useful life of 5 years. If the asset’s salvage value—that is, what the company expects to sell the asset for when the asset is at the end of its useful life—is $10,000, the depreciation each year is $18,000 per year: In other words, 20% of the asset’s cost (less salvage value) is depreciated each year.
Other depreciation methods • Whereas straight-line depreciation results in the same depreciation expense each period, accelerated methods result in more depreciation in earlier years of the asset’s life and less in the later years. • One group of accelerated methods is the declining balance methods of depreciation. • In the declining balance methods, we apply a fixed percentage against the carrying value of the asset, which declines each year with the depreciation.The result is a declining depreciation expense through time.
Other depreciation methods • Example: applying the 150% declining method (which is known as 150 DB) in our example is 150% of the straight-line rate, or 1.5 × 20% = 30%. • For the first year, the asset’s depreciation is 30% × $90,000, or $27,000. In the second year, there is $90,000 - 27,000 = $63,000 remaining to be depreciated. Twenty percent applied against this value produces $18,900 for the second year’s depreciation. • Another declining balance method, the double-declining balance (DDB) method, follows a similar process, but the rate is twice that of straight-line. We often refer to the DDB method as the 200DB method because the rate is 200% of the straight-line rate.
Earnings per share Basic earnings per share (basic EPS) are the earnings per share based on the weighted average of the number of common shares outstanding during the fiscal period: Companies are also required to report diluted earnings per share (diluted EPS), which is simply the adjusted net income divided by the total possible number of shares that could be outstanding if all potentially dilutive securities outstanding were converted into common shares:
The statement of cash flows • The statement of cash flows is a summary of the sources and uses of cash in the company over a period of time, such as a fiscal quarter or a fiscal year. The statement of cash flows begins with net income from the income statement. • There are three major parts: • Cash flow for/from operations (CFO) -cash flow from the day-to-day operations of the business; the result of subtracting the increase in net working capital from traditional cash flow • Cash flow for/from investing (CFI) - cash flow, on net, from investing activities • Cash flow for/from financing (CFF) - cash flow, on net, from financing activities
Problem 1 Which of the following statements has accounts reported as of a specific date? Balance sheet Income statement Statement of cash flows Statement of owners equity
Problem 2 On which of the following statements will you find comprehensive income? Balance sheet Income statement Statement of cash flows Statement of owners equity