Download
1 / 29
290 likes | 461 Views
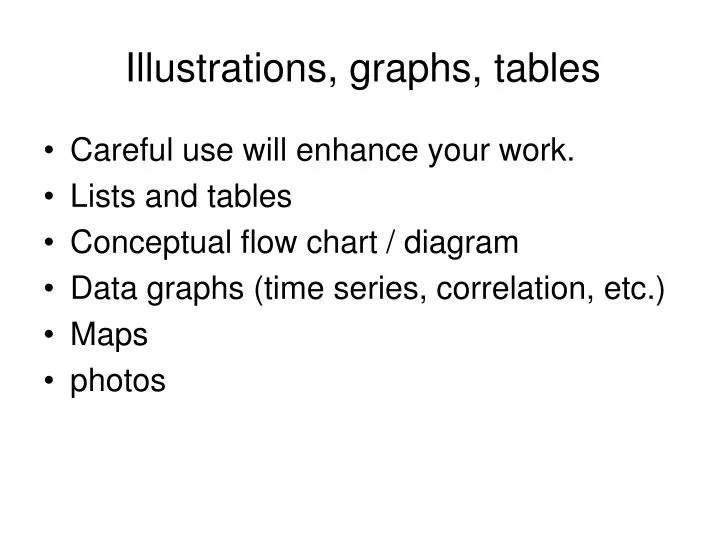
Illustrations , graphs, tables. Careful use will enhance your work. Lists and tables Conceptual flow chart / diagram Data graphs (time series, correlation, etc.) Maps photos. The conceptual structure of the International Land Science Program See:

E N D
Illustrations, graphs, tables • Careful use will enhance your work. • Lists and tables • Conceptual flow chart / diagram • Data graphs (time series, correlation, etc.) • Maps • photos
The conceptual structure of the International Land Science Program See: GLP (2005) Science Plan and Implementation Strategy. IGBP Report No. 53/IHDP Report No. 19. IGBP Secretariat, Stockholm. 64pp.
Hurricane Flood Earthquake Tsunami wildfire Prevention: modify the event (Dams, levees, cloud seeding, etc.) Magnitude, frequency, duration, extent Natural Events System Natural Hazard Impacts Response Human use System economic loss Vulnerability Populations Agriculture Settlement Transportation Housing Adapt: reduce human vulnerability: (building codes, land use regulations, etc.) Spread / Share the Loss: Disaster aid, insurance
Growth in the American West • More “boom” than “bust”