Download
1 / 51
510 likes | 710 Views
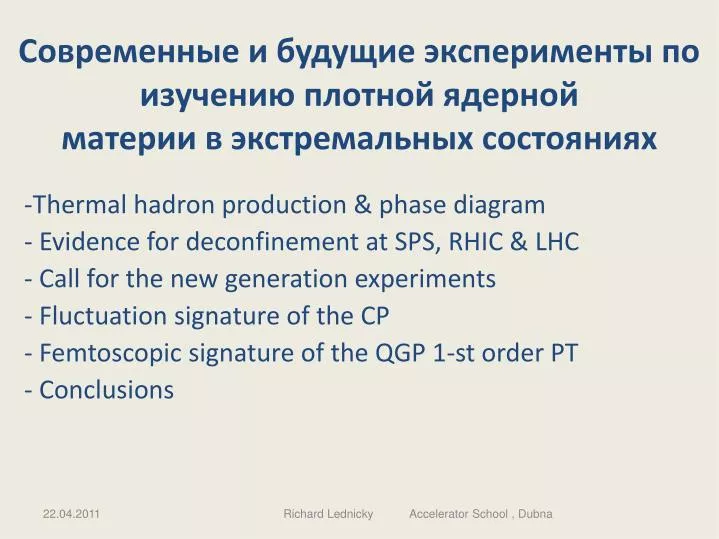
Thermal hadron production & phase diagram Evidence for deconfinement at SPS, RHIC & LHC Call for the new generation experiments - Fluctuation signature of the CP Femtoscopic signature of the QGP 1-st order PT - Conclusions.

E N D
Thermal hadron production & phase diagram • Evidence for deconfinement at SPS, RHIC & LHC • Call for the new generation experiments - Fluctuation signature of the CP • Femtoscopic signature of the QGP 1-st order PT - Conclusions Современные и будущие эксперименты по изучению плотной ядернойматерии в экстремальных состояниях Richard Lednicky Accelerator School , Dubna
March 2009 9.3.2009
Exp.: Thermal f-o (T - μB): SPS SPS RHIC nantiparticle nparticle RHIC
Thermal Model T 165 MeV B 0 nantiparticle nparticle
1st order PT crossover
& MPD @ NICA/JINR Lattice says: crossover at µ = 0 but CP location is not clear CP: T ~ 160-170 MeV, μB > 200 MeV
April, Critical opalescence Water liquid-gas CP: 374 °C and 218 atm
QCD phase diagram The most intriguing and little studied region of the QCD phase diagram: • Characterized by the highest net baryon density • Allows to study in great detail properties of the phase transition region • Has strong discovery potential in searching for the Critical End Point and manifestation of Chiral Symmetry Restoration • Recently became very attractive for heavy-ion community: RHIC/BNL, SPS/CERN, FAIR/GSI, NICA/JINR Deconfined matter (high e,T,nB): e >1 GeV/fm3, T>150 MeV, nB>(3-5)n0 Challenge: comprehensive experimental program requires scan over the QCD phase diagram by varying collision parameters : system size, beam energy and collision centrality
Evidence for deconfinement at SPS - Strangeness enhancement & K/pi horn • Plateau in mT(pT2+m2)1/2 in the entire SPS energy range • J/ suppression • UrQMD: predicts too small tr. flow at top SPS energies • too large femtoscopic radii & too large Rout /Rside NA49:anomalies in hadron production: “Horn” – sharp maximum in the K+/pi+ or strangeness-to-entropy ratio in the transition region “Step” - plateau in the excitation function of the apparent temperature or mt of hadrons NA50: anomalous J/y suppression in central A+A QGP HG Mixed phase Quarkonium suppression by color screening
KP’71-75: Correlation Femtoscopy momentum correlations of emitted particles are sensitive to space-time structure of the source due to QS & FSI Fermi’34 CF=1+(-1)Scos qx total pair spin exp(-ip1x1) p1 2 x1 ,nns,s x2 1/R0 1 p2 2R0 nnt,t x = x1-x2 q = p1-p2 |q| 0
BW: Retiere@LBL’05 , , Flow & Radii x-out, y-side, z-long pion 0.91c 0.73c ← Emission points at a given tr. velocity px = 0.15 GeV/c 0.3 GeV/c Rz22 (T/mt) Ry2 = y’2 Kaon Rx2= x’2-2vxx’t’+vx2t’2 t’2 (-)2 ()2 px = 0.53 GeV/c 1.07 GeV/c For a Gaussian tr. density profile: (r) ~ exp(-r2/2RG2) and a linear flow velocity profile: F (r) = 0r/ RG Proton px = 1.01 GeV/c 2.02 GeV/c Ry2 = RG2 / [1+ 02 mt /T] Rz = evolution time Rx = emission duration Rx , Ry 0= tr. flow velocity pt–spectra T= temperature
AGSSPSRHIC: radii Clear centrality & mt dependence Weak energy dependence STAR Au+Au at 200 AGeV 0-5% central Pb+Pb or Au+Au R ↑ with centrality & with mt only Rlong slightly ↑ with energy Rside R/(1+mt F2/T)½ tr. collective flow velocity F Rlong (T/mt)½ Evolution (freeze-out) time
Femto-puzzle I Contradiction with transport and simple hydro calcul. • Small space-time scales • their weak energy dep. • Rout/Rside ~ 1 • Basically solved due to the initial flow increasing with energy (likely related to the increase of the initial energy density and partonic energy fraction)
Elliptic flow v2vs energy increasing fraction of the partonic matter & a saturation on the ideal liquid level at the top RHIC energy Hydro expansion transfers the initial spatial eccentricity into elliptic flow v2 v2 v2/ε vs particle density in the transverse plane v2 for midrapidity 25% most central collisions AGS SPS IDEAL RHIC
Evidence for deconfinement at RHIC • Large elliptic flow: v2/ close to ideal liquid value at top RHIC energies • CQNS of v2 • CME (Chiral Magnetic Effect) • Jet quenching Strong high pT suppression in hadron production highly opaque matter for colored probes (not for ’s) Constituent quark number scaling of elliptic flow partonic collectivity in a relativistic quantum liquid sQGP matter at RHIC
News from BES @ RHIC (LPV)
Evidence for deconfinement at LHC • Direct observation of jet quenching • Similar differential elliptic flow v2(pt) as at RHIC close to ideal • liquid but increased /s at LHC compensating the increase of and T • (from liquid to gas ?) • Femtoscopic correlations confirmed the multiplicity scaling of the • correlation volume universal freeze-out density Universal freeze-out density First direct evidence of strong jet quenching observed in LHC HI collisions by ATLAS and CMS
Describing medium Qin, Muller, arXiv:1012.5280 • collisional energy loss by all shower partons • radiation outside the jet cone • scattering of the radiated gluons outside the jet cone
Observed similar differential elliptic flow v2(pt) as at RHIC increased /s at LHC compensating the increase of and T : from liquid to gas ? Song, Bass, Heinz, arXiv:1103.2380 v2 in Hydro+UrQMD transport code /s = 0.16 at RHIC 0.20-0.24 at LHC Tomasik, Levai, arXiv:1104.3262 ~25% of v2 may come from hard partons /s > 0.20-0.24 at LHC Xu, Ko, arXiv:1101.2231 v2 in AMPT multiphase transport model parton = 10 mb at RHIC 1.5 mb at LHC /s ~ (T2parton)-1 increased T at LHC more than compensated by decreased parton Bhatt, Mishra,Sreekanth, arXiv:1103.4333 /s with T may lead to cavitation (gas bubbles) hydro at LHC applic. up to 2 fm/c only ?
Femtoscopy of Pb+Pb at LHC arXiv:1012.4035 All radii increase with Nch from RHIC to LHC multiplicity scaling of the correlation volume universal freeze-out density The LHC fireball: • hotter • lives longer & • expands to a larger size Freeze-out time f from Rlong=f(T/mt)1/2
Dense matter (collective flows) also in pp collisions at LHC (for high Nch) ? • pt increases with nch and particle mass • BE CF vs nch and pt points to expansion at high nch • Ridge effect observed in angular correlations at high nch Ridge effect R(kt) at large Nch expansion
pt -spectra: CDF Tevatron & LHC data vs EPOS: MC code based on DTU with/without hydro Collective (hydro) flow velocity t pt2 ~ mt2 Ks without hydro with hydro chrg with hydro with hydro without hydro without hydro
Femtoscopy of p+p at LHC ALICE arXiv:1101.3665 CMS arXiv:1101.3518 pt dependence increasingly important with increasing Nch Collective flow in pp collisions at high Nch
Femtoscopy of pp collisions at LHC vs EPOS model with/without hydro without hydro arXiv:1104.2405: EPOS with hydro Collective flow in pp increases with Nch Nmin bias 5*Nmin bias too small factor of 3 without hydro
First observation of new phenomenain p-p Observation of Long-Range Near-Side Angular Correlations in Proton-Proton Collisions at LHC CMS Collaboration, JHEP 9 (2010) 1 arXiv:1009.4122 Ridge Several papers on possible interpretations. New set of measurements to understand better the dynamics. It will be very interesting to compare the measurements in pp and heavy-ions modes.
Color flux tubes longitudinal translation invariance of transverse flows Origin of Ridge in Rel. HICs: Similar picture in HM pp: Increasing number of color flux tubes with multiplicity similar energy densities at HM pp as in Rel. HICs similar tr. Flows (Ridge)
EPOS+hydro: energy density & radial velocity @ s = 0, =1.3 fm/c HM pp 7 TeV • very fast expansion; drops from ~50 to ~3 GeV/fm3 in 1.3 fm/c and radial velocity near boundary achieves 80% c Similar collective expansion expected in HM pp & AA Energy density GeV/fm3 Radial velocity %c
Ridge in HM pp 7 TeV pt= 1-3 GeV/c K.Werner et al. arXiv:1011.0375 EPOS+hydro: Ridge EPOS w/o hydro: No Ridge
Lessons from the 1st generation HI experiments • Evidence for the onset of deconfinement @ low SPS energies √sNN ~ 7 GeV & sQGP matter @ RHIC • 2nd generation HI experiments (STAR, NA61, ALICE, • ATLAS, CMS) continue the exploration of the QCD • phase diagram But, a further research program in studying the QCD phase diagram with the existing detectors appears to have drawbacks due limitations either in accelerator parameters (energy range, luminosity) or by constrains in experimental setups (acceptance, event rates, etc..)
Motivation for the next generation of HI experiments 3nd generation experiment with dedicated detectors are required for more sensitive and detailed study
2nd generation HI experiments STAR/PHENIX @ BNL/RHIC. Originally designed for higher energies (sNN > 20 GeV), low luminosity for LES program L<1026 cm-2s-1 for Au79+, too few energies. NA61 @ CERN/SPS. Fixed target, non-uniform acceptance, few energies (10,20,30,40,80,160A GeV), poor nomenclature of beam species ALICE, ATLAS, CMS @ CERN/LHCToo high energies (sNN > ~1TeV ), poor nomenclature of beam species 3nd generation HI experiments CBM @ FAIR/SIS-100/300 Fixed target, E/A=10-40 GeV, high luminosity, But, max. energies in 2018! MPD @ JINR/NICA.Collider, small enough energy steps in the range sNN = 4-11 GeV, a variety of colliding systems, L~1027 cm-2s-1 for Au79+ at 9 GeV.
Why the NICA and FAIR energy range is so important The energies of the NICA and FAIR sit right on top of the region where the baryon density at the freeze-out is expected to be thehighest. It will thus allow to analyze the highest baryonic density under laboratory conditions. Also, in this energy range the system occupies a maximal space-time volume in the mixed quark-hadron phase (the phase of coexistence of hadron and quark-qluon matter similar to the water-vapor coexistence-phase).
FREEZE-OUT AND PHASE DIAGRAMS Critical end-point 1st order PT Ivanov, Russkikh,Toneev ’06 : At lower energies the system spents an essential time in the mixed phase Randrup, Cleymans ‘06 : NICA&FAIR sNN = 9 AGeV The freeze-out baryon density is maximal at sNN= (4+4) GeV covered by NICA and FAIR SNN = 4-11 GeV is a most promising energy region to search for mixed phase & critical end-point Besides NICA & FAIR also RHIC & SPS plan to partly cover this energy range
CP: ______ _________ ___
CP signals in multiplicity and pt fluctuations for ξ =3 and 6 fm assuming CP at T=162 MeV µB=360 MeV & Gaussian fluctuation shape with the width of 10 MeV in T 30 MeV in µB ω= D(N)/‹N› pt = (D(∑pti)/‹N›)1/2-(D(pt))1/2 ξ =6 fm pt 40 (10) MeV/c for ξ =6 (3) fm 10 (2.5) for NA49 acc.= 0.24 M. Stephanov .. ’99 B. Berdnikov .. ‘00 ξ <~3 fm due to finite fireball lifetime pt< 2 (.5) MeV if max partonic energy fraction~20% asexpected in PHSD 3 fm
Cassing – Bratkovskaya: Parton-Hadron-String-Dynamics Perspectives at FAIR/NICA energies
News from BES @ RHIC s==0 for Gaussian distr.
Rischke & Gyulassy, NPA 608, 479 (1996) With 1st order Phase transition Femtoscopic signature of QGP onset 3D 1-fluid Hydrodynamics Initial energy density 0 Long-standing signature of QGP onset: • increase in , ROUT/RSIDEdue to the Phase transition • hoped-for “turn on” as QGP threshold in 0is reached • decreases with decreasing Latent heat & increasing tr. Flow (high 0or initial tr. Flow)
Femto-puzzle II No signal of a bump in Rout near the QGP threshold (expected at AGS-SPS energies) !? – likely solved due to a decrease of partonic phase at these energies
Radii vs fraction 1 of the large scale: very weak sensitivity solving Femtoscopy Puzzle II r Input: 1, 2=1-1, r1=15, r2=5 fm 1-G Fit: r , Typical 1-G (3d) fit: e.g., NA49 central Pb+Pb 158 AGeV Y=0-05, pt=0.25 GeV/c Rout=5.29±.08±.42 Rside=4.66±.06±.14 Rlong=5.19±.08±.24 =0.52±.01±.09 1 1 1 2-G Fit: 1, 2, r1,r2 r1 r2 2 1 1 1