Download
1 / 41
410 likes | 482 Views
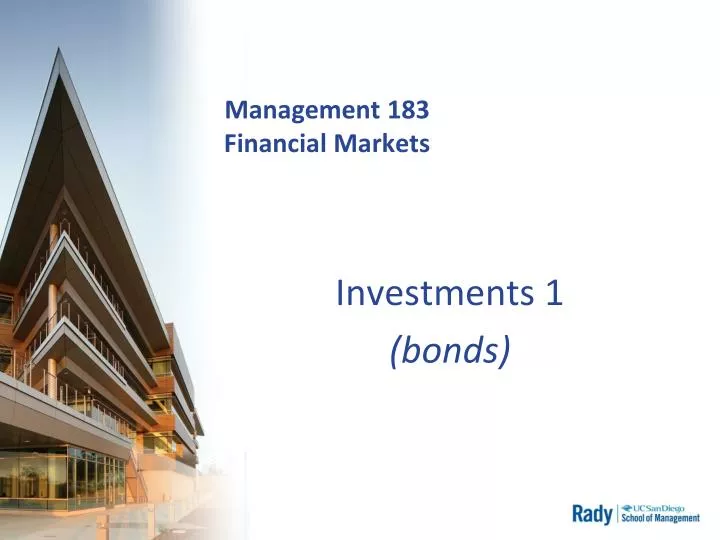
Management 183 Financial Markets. Investments 1 (bonds). To help to finance Companies Circa 2010-11 Annual Working Capital increases = $ 150 Billion Annual Capital Expenditures = $ 900 Billion = $ 1,050 Billion Source of funds: Annual Earnings = ($ 800 Billion)

E N D
Management 183Financial Markets Investments 1 (bonds)
To help to finance Companies Circa 2010-11 Annual Working Capital increases = $ 150 Billion Annual Capital Expenditures = $ 900 Billion = $ 1,050 Billion Source of funds: Annual Earnings = ($ 800 Billion) GAP $ 250 Billion 2. New Debt Issued = ($ 300 Billion) Repurchases of Equity = $ 50 Billion Capital Markets
The Assets Fixed Income Bonds Real Estate Equity Shares Units Derivatives Options Futures The Process Asset Allocation Equity/Fixed 40/60 80/20 120/20 ? Security Selection Security Analysis Assets & Investing Risk Return Trade-off
Risk and expected Return Return Risk
Banks Commercial Banks Investment Banks Funds Mutual Hedge Pension Private Equity (“PIPES”) Foreign Exchange Commodity Securitization GNMA CMOs, CDOs Bundling (Un) STRIPS Engineering Custom-tailored Risk/Return Synthetics – derivative hedges – mimic something Intermediation and Innovation
Money Market Certificates of Deposit U.S. Treasury Bills Money Market Funds Bond Market U.S Treasury Notes and Bonds U.K. Gilts and Consols Municipal Bonds Corporate Bonds Equity Market Common Stock Preferred Stock Derivative Market Options Futures Other Swaps Pass-throughs Financial Instruments
Fixed CDs – bank time-deposits Paper – unsecured, trade-able company debt Acceptances – bank promises Eurodollars - $ denominated foreign bonds Repos, Reverse Repos – of treasury debt Treasuries – bills, notes, bonds Rates Prime Fed Funds LIBOR TED Spread : the 3-month Treasury less LIBOR Fixed Income Securities & Rates
TED Spread Denominated in basis points (bps). Historically 10 to 50 bps – average 30 bps A rising TED spread indicates shrinking liquidity –an indicator of perceived credit risk: T-bills are considered risk-free LIBOR reflects the credit risk of lending banks. Widening TED spread is a sign that lenders believe default risk on interbank (counterparty) loans is increasing.] 2007 average 150 – 200 bps September 2008 > 300 bps 10/10/2008 465 bps
Pick the Federal Reserve Bank Chairmen c a b Click Glenn Hubbard for the parody d e
What’s the problem with the Fed balance sheet? Not it’s size. But the quality of the assets. The largest piece of the pie is pass-thru-securities (pass thrus from sub-prime mortgages) CDO’s. No one knows the real value of this balance sheet. Did the Fed break the law? (Federal Reserve Act of 1913) by taking less than Federal government backed securities?
Inflation? Or Deflation? The problem is losing dollar strength. Most people get this wrong. The effects are similar: Prices go up – but the cause is subtly different. The weakening dollar due to the extreme moves by the Fed undermine Americans buying power.
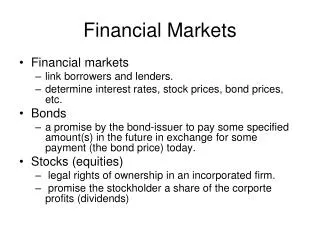
Bonds • Debt Security – corporate or government borrowing • Also called a Fixed Income security • Covenants or Indenture define the contract (this can be complex) • 2 types of Payments: interest principal • Interest payments are the Coupon • Principal payment is the Face
Bond Basics • Fixed Income Securities: A security such as a bond that pays a specified cash flow over a specific period. Fixed Income Securities vs. Common Stock Fixed Claim Residual Claim High Priority on cash flows Lowest Priority on cash flows Tax Deductible Not Tax Deductible Fixed Maturity Infinite life No Management Control Management Control Bonds Hybrids (Combinations Common Stock of debt and equity)
Bond Analysis • Characteristics – • Types: mortgage/asset-backed, callable or puttable?, convertible?, senior or subordinated, floating rate, zero coupon or stripped • Denomination (Par value) Face • Coupon, Dates of Coupon Payments • Sinking Funds? • Rating • Pricing – present value of future cash flows • Yields: • Coupon yield • YTM • RCYTM • Sensitivity to Time, i.e. maturity • Sensitivity to changes in interest rates
Treasury Bills, Notes, & Bonds • Bills – 90 days to 6 months • Notes – 1 year up to 10 years • Bonds – to 30 years • Face (denomination) of $1,000; quotes in $100’s • Coupon (rate) paid semi-annually • Prices quoted in points (of face) + 1/32 • No default / credit risk
106.85-0.12(-0.11%) Apr 9, 2014 • 52 Wk. High111.10 • 52 Wk. Low103.14 BONDNews Why the market may be underpricing fear Bondinvestors take note: This could be trouble Pressure rises on Gross as investors pull $3.1 billion from Pimco's flagship fund
Bond Pricing As with all Financial Assets The price is a Present Value of the expected cash flows discounted at the appropriate (relative to risk) discount (interest) rate.
Coupon Payments • Relative to other types of securities, bonds produce cash flows that an analyst can predict with a high degree of precision. • Fixed rate • Variable rate • Zero coupons • Consols – consolidated annuities - perpetuities introduced in 1751.
Rates Risk-adjusted Discount Rate (RADR) Annual Percentage Rate (APR) Annual Percentage Yield (APY)
Bond Pricing • DCF Technique PB = Price of the bond Ct = interest or coupon payments T = number of periods to maturity r = discount rate
20 S 40 1 = + P 1000 B t 20 (1+.03) (1+.03) t =1 Bond Pricing Ct = 40 (SA), F = 1000, T = 20 periods, r = 3% (SA) PB = $1,148.77
Three Bonds in a 10 percent world … Insert Figure 4-6 here.
Bond Pricing • Zero Coupon Bonds • Consols – Zero Face Bonds
Bond Yields • Yield to Maturity: The discount rate that makes the present value of a bond’s payments equal to its price. • Internal rate of return from holding bond till maturity. • Example3 year bond with interest payment of $100, principal of $1,000 and current price of $900 • Assume coupon proceeds are reinvested at the YTM.
20 S 40 1 = + P 1000 B t 20 (1+.03) (1+.03) t =1 Bond Pricing • Example (annual coupon paid SA) in a 6 percent world.Solving for Price: 10-yr, 8% Coupon Bond, Face = $1,000 Ct = 40 (SA), P = 1000, T = 20 periods, r = 3% (SA) PB = $1,148.77
Approximate Yield to Maturity • Approximating YTMUsing the earlier example Avg. Income = 80 + (1000-1149)/10 = 65.10 Avg. Price = (1000 + 1149)/2 = 1074.50 Approx. YTM = 65.10/1074.50 = 0.0606 Actual YTM = 6.00%
Bond Yields • Prices and Yields (required rates of return) have an inverse relationship • When yields get very high the value of the bond will be very low • When yields approach zero, the value of the bond approaches the sum of the cash flows
Price Yield
Bond Risks • Price Risks • Default risk • Interest rate risk • Convenience Risks • Call risk • Reinvestment rate risk • Marketability risk
Default Risk • The income stream from bonds is not riskless unless the investor can be sure the issuer will not default on the obligation. • Rating companies • Moody’s Investor Service • Standard & Poor’s • Duff and Phelps • Fitch • Kroll
Default Risk • Rating Categories • Investment Grade Bonds • Speculative Grade Bonds S&P Moody’s Very High Quality AAA, AA Aaa, Aa High Quality A, BBB A, Baa Speculative BB, B Ba, B Very Poor CCC, CC, C, D Caa, Ca, C, D
Bond Yields • Current or Annual Yield: Annual coupon divided by bond price. • Different from YTM • Accrued Interest • Interest is earned for each day that a bond is held, although interest payments are generally made twice a year only. • A bond buyer must pay the accrued interest to the seller of the bond. • dirty price = bond price + accrued interest • clean price = bond price • By convention, accrued interest is calculated using a 360-day year.
Bond Pricing: Accrued Interest • Example • Consider a bond that is paying a six percent annual coupon rate in semiannual payments with a yield to maturity of 10 percent and two years and ten months until its maturity. • What is the quoted price or clean price? • What is the dirty price?
Bond Pricing: Accrued Interest • What is the quoted price or clean price? Step One: Calculate the present value of a bond that has 2.5 years until it matures and pays semiannual interest coupons. Step Two: The $30 coupon is added to $913.39. The sum is $943.19. Step Three: The value $943.19 is discounted back 4 months to the purchase date.
Bond Pricing: Accrued Interest • What is the dirty price? Calculate the accrued interest for two months. There are 180 days between semiannual coupon payments and 30 days in a month. Therefore 60/180 is the fraction of the coupon payment earned by the seller. In other words the accrued interest is $10 and the dirty price is $923.16.
Forward Rates term yearsrat year One-year rate one year from now One-year rate two years from now