Download
1 / 57
690 likes | 949 Views
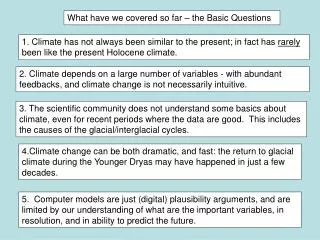
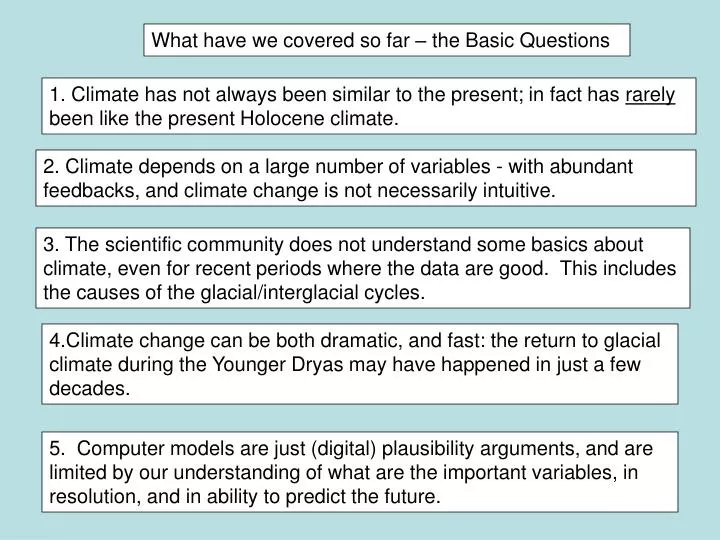
What have we covered so far – the Basic Questions. 1. Climate has not always been similar to the present; in fact has rarely been like the present Holocene climate. 2. Climate depends on a large number of variables - with abundant feedbacks, and climate change is not necessarily intuitive.

E N D
What have we covered so far – the Basic Questions 1. Climate has not always been similar to the present; in fact has rarely been like the present Holocene climate. 2. Climate depends on a large number of variables - with abundant feedbacks, and climate change is not necessarily intuitive. 3. The scientific community does not understand some basics about climate, even for recent periods where the data are good. This includes the causes of the glacial/interglacial cycles. • Climate change can be both dramatic, and fast: the return to glacial climate during the Younger Dryas may have happened in just a few decades. 5. Computer models are just (digital) plausibility arguments, and are limited by our understanding of what are the important variables, in resolution, and in ability to predict the future.
Summary: Climate Conditions during LGM • Insolation rates about the same as today. • Colder (~ -4 º C globally and ~ -10 ºC (or – 20) near the poles and ~-2 to -3 ºC in tropics). • Ice Sheet volume was ~ twice today. • Sea Level lower by ~ 125m. Exposed large continental shelf areas. • Drier and dustier (globally). • Reduced atmospheric CO2 and CH4 levels • Vegetation more arctic like (tundra, steppe). • Deep Ocean circulation more sluggish.
Rise in Temperature and Atmospheric Gases • Temperature, CO2 and CH4 start increasing ~18K yrs. • Implies changes in radiation budget (temperature), ocean circulation /biology/chemistry (CO2) and precipitation (CH4).
colder warmer Millenial Scale Oscillations in Temperature DURING the Last Glacial Period.It wasn’t just cold back then…. During last glacial period (20-100 K yrs BP) there were many large and fast temperature swings recorded in the Greenland ice cores and deep sea sediments from N. Atlantic.
Heinrich Events – massive discharge of icebergs (and ice-rafted rocks) into the North Atlantic Dansgaard-Oeschger Events – Large (10°C), rapid warming events in the North Atlantic.
Summary: Rapid Climate Change • During the last 100K yrs there have been repeated oscillations between warm (Dansgaard-Oeschger: D-O) and cold (Heinrich) conditions, with very fast temperature changes (7ºC in 50 yrs in Greenland). • The most recent (strong) cold event occurred about 12K yrs ago (Younger-Dryas) during the transition from LGM to current interglacial period. • Current hypothesis is that variations in deep water formation rates in N. Atlantic driven by salinity, and thus poleward heat transport, is a likely mechanism for YD. • These rapid climate change events are strongest in the N. Atlantic, but some evidence that they occurred globally. • Generally, there is an anti-phasing of temperature fluctuations between N. and S. Hemispheres.
Abrupt Climate Change between 60 kyrs and 23 kyrs. Greenland ice cores Portugal alkenones Greenland IC methane Caribbean sediments Bermuda alkenones Santa Barbara forams ALL consistent with a 4 deg C temperature increase during D-O events
WERE THE MILLENNIAL OSCILLATION EVENTS GLOBALLY DISTRIBUTED? Answer – SORT OF... CIRCLES ARE SITES WHERE THE DATA COVER APPROPRIATE TIME RANGE AND HAVE ADEQUATE RESOLUTION. FILLED CIRCLES ARE THOSE THAT SHOW D-O EVENTS; OPEN CIRCLES ARE THOSE THAT DON’T SHOW D-O EVENTS.
Heinrich Events Heinrich Events: Ice Rafted Debris. Remember, these are COLD events
Six periods of extreme cooling in the Northern Hemisphere—known as Heinrich events—were marked by an enhanced discharge of icebergs into the North Atlantic Ocean. Need high on-land snow accumulations to form thick ice sheet. Then need cold temperatures to form sea ice – that butresses the ice sheet on land (thickens) Then have warm ocean current melt fringing around continent and land-ice sheet discharges rapidly. H-event. Increased ocean temperature reduces ice-shelf width, reducing buttress that are holding back ice sheet flow into the sea. Reduced butress increases ice-stream velocities.
Standard simulation. a–d, Time evolution of the oceanic forcing (a) (in terms of basal melting under the ice shelf), grounded ice thickness (b),ice-shelf length (c) and iceberg calving (d). e, The evolution of the same variables as well as the ice velocities at the grounding line over a simulated Bond cycle. Alvares-Solas et al, Nature, 2010.
Dansgaard-Oeschger and Heinrich Events recorded in the N. Atlantic Region Fairly consistent ~1500 yr period between warm periods (D-O events). Several of the coldest periods are associated with Heinrich events (e.g., Younger-Dryas). Sawtooth pattern of fast warming and slow cooling.
Heinrich events are defined as ICE-RAFTED debris, found in sediments in the mid-North Atlantic sediments. How are D-O events defined? What parameter defines a WARM D-O event?
Meltwater Pulses as a Climate Change Trigger • Pulse of freshwater discharge into the N. Atlantic would reduce the formation rate of deep water (N. Atlantic Deep Water) by reducing salinity (density) of surface water. • This would reduce the ocean’s transport rate of heat via Gulf Stream to N. Atlantic region and cause cooling in the region.
NOTE that there are a lot more D-O warm cycles than there are H-events. That is because in order to have H-events, you need the ice sheets to be advancing – which requires both cold temperatures AND moisture back on land to force them to advance (which takes time). I.e., the H-events come at the end of a cold period that is preceded by a warm period.
Possible Mechanism: Salt Oscillator Hypothesis: Changes in the salinity of the N. Atlantic, resulting from ice melting or ice formation, determines the strength of NADW formation and, as a result, changes the rate of heat transport to the N. Atlantic region. The H-event
Model Simulations Does S. Hemisphere warm when the N. Hemisphere cools?
Salt Oscillator: Explaining the time sequence of D-O and Heinrich events Hypothesis: The sawtooth pattern of temperature change is caused by a slow decrease in rate of NADW formation, until it eventually stops, which is then followed by rapid return of NADW formation after a critical value of salinity is reached. small big
Model Simulations Does S. Hemisphere warm when the N. Hemisphere cools?
Inter-hemispheric Seesaw • Model simulations of Heinrich events indicate that reduced heat transport into the N. Atlantic yields less heat loss from S. Hemisphere and thus warming. • Models indicate that when NADW formation is reduced, then Antarctic Bottom Water formation rate increases, which in turn means higher ocean to atmosphere heat transfer and warmer temperatures in Antarctica. • Temperature records during Y-D from Antarctic ice cores indicate warming while Greenland cooled.
Possible Impact of Reduced NADW Formation Rates on Air Temperatures
Antarctic Greenland Comparison of Antarctic air temperature from ice cores inferred from d18O and dD records) to the northern Greenland d18O record from the NGRIP ice core for the time interval 10,000– 60,000 years ago. All records are synchronized on the basis of their measured air bubble CH4 (methane) contents. Shows a one-to-one match between Antarctic warming events and a corresponding cold stadial period in Greenland that has been attributed to the bipolar seesaw pattern in temperature predicted from models of variations in the ocean’s meridional overturning circulation.
Transition from Glacial to Interglacial Conditions • Rapid Bolling-Allerod warming event at ~14.5 Kyrs. • Transition from the LGM climate to present interglacial climate was not smooth. • Younger-Dryas is a period of cooling at ~12 Kyrs that lasted for ~ 1000 yrs. Greenland Ice Core
Younger Dryas – rapid return to glacial climate during warm-up to present inter-glacial period.
Antarctic warmed during Younger Dryas • Antarctica temperature increases during Y-D cooling. Ice core data. • Globally, atmospheric CO2 levels increase. • Globally, atmospheric CH4 levels decrease.
Ice Sheet Retreat Retreat begins ~18K and BOTH LIS and CIS ice sheets are gone by ~6K. (Real calendar age = 14C age plus ~ 1700 yrs.)
Rapid Temperature Change during the Y-D Sawtooth Pattern of Y-D Heating is rapid, Cooling is slower At end of Y-D, temperature in Greenland increased by 7ºC in 50 yrs.
Possible Pathways of Meltwater Flow Also out the Hudson River valley
Appearance of Meltwater Pulses From sea level record From d18O-CaCO3 record Why do meltwater pulses show up in d18O-CaCO3 record?
Were D-O events and Younger-Dryas global? Map showing locations where abrupt climate changes (i.e., D-O events) have been documented in marine sediments (red) or polar ice (blue). Yellow dots show those locations where the last of these events (i.e., Younger Dryas) is recorded by major advances of mountain glaciers. While for most of the globe, these events are in phase, in parts of the Southern Ocean and of the Antarctic ice cap, they are clearly anti-phased.
Rapid Climate change evidence in Santa Barbara Basin • Warming events associated with negative d13C, which author interprets is a result of methane hydrate release. • Did ocean circulation rates change between warming and cooling events? Conclusion: a LOT of methane was released during the D-O interstadials into the BOTTOM water of SB Basin.
Summary: Rapid Climate Change • During the last 100K yrs there have been repeated oscillation between warm (D-O) and cold (Heinrich) conditions, with very fast temperature changes (7ºC in 50 yrs in Greenland). • The most recent (strong) cold event occurred about 12K yrs ago (Younger-Dryas) during the transition from LGM to current interglacial period. • Current hypothesis is that variations in deep water formation rates in N. Atlantic driven by salinity, and thus poleward heat transport, is a likely mechanism. • These rapid climate change events are strongest in the N. Atlantic, but some evidence that they occurred globally. • Generally, there is an antiphasing of temperature fluctuations between N. and S. Hemispheres.
Sea Level can change quickly! Onset of the Last Glacial Maximum (30 kyr to 19 kyrs) was actually quite fast, with 30 to 40 meters of sea level drop in 1000 to 2000 years. Indicating that ice sheets can grow quickly if temperature and moisture conditions are right (Lambeck et al, Nature, 2002). Relative sea level and insolation for the last glacial cycle. a, The relative sea-level curve for the last glacial cycle for Huon Peninsula supplemented with observations from Bonaparte Gulf, Australia. The timescale is based on uranium-series ages of corals older than about 30 kyr and on calibrated radiocarbon ages of the younger corals and sediments. The main oxygen isotope stages MIS-5 to MIS-1, including the substages of MIS-5, are identified. The results represent conservative estimates, with each oscillation identified being supported by several precisely dated points from one or more reef section, by the stratigraphic relationship of the sampled corals to the reef crest position, and by models of reef growth in an environment of changing sea levels. Solar insolation curve is 65°N.
Comparison of MIS-3 sea-level oscillations and Atlantic sediment records. a, Sea-level curve for MIS-3 coral terraces from Huon Peninsula, Papua New Guinea. Upper and lower bounds areshown. b, Neogloboquadrina pachyderma abundances from the North Atlantic core plotted on the same calendar timescale. The original radiocarbon ages from the depths in the core marked by (+) have been converted to calendar ages. The extent of major Heinrich events identified in the North Atlantic cores, corresponding to cold periods, are within the colour bands. The arrows identify the mean timing of Heinrich events. cIRD from two South Atlantic cores TTN057-21 and TTN057-13/1094 (ref. 60). Within the uncertainties of the calendar age determinations, the South Atlantic IRD peaks correspond to the cold events in the North Atlantic.
Changes in global ice volume from the time of the LGM to the present. The figure shows ice-volume equivalent sea level for the past 20 kyr based on isostatically adjusted sea-level data from different localities73,93–96. Because of spatial variability of the sea-level response to the glacial and water loading, sea-level observations from different localities should not be combined into a single sea-level curve unless the isostatic effects can be shown to be similar. The ice-volume equivalent sea-level function used here corresponds to the observed sea levels corrected for these effects75. It relates to the change in total ice volume, with respect to the present, of continent-based ice and any ice grounded on the shelves. With one exception, the results indicate an ice volume at the LGM that was ~552x 106 km3 greater than at present. The error bars, not shown, are typically 0.1–0.15 kyr in calendar years and 5 m or less in position. MWP-1A refers to the timing of the meltwater pulse at ~14 kyr ago. At the Younger Dryas (YD) at ~12 kyr ago, sea-level rise may have momentarily halted.
Sea Level Rise • Use 14C and 230Th/238U to date the age of a sequence of submerged corals that lived close to the sea surface. • The rate of sea level rise has pulses. (14C ages are too young by up to ~3K yrs.)
Short discussion on why 14C years differ from calendar years If you are dating corals (say from Barbados), you can use both 14C and Th/U age dating techniques. BUT they don’t agree. 14C dates are systematically younger than the Th/U dates. On the same samples.
Tree rings (count rings and do 14C dating on wood) show the same effect, the 14C dates are TOO YOUNG.
Here’ s why. 14C is generated in the atmosphere by cosmic rays hitting 14N. The 14C decays at a constant rate, but the rate of PRODUCTION of 14C depends on the strength of the geomagnetic field. If the field is strong, fewer cosmic rays hit the atmosphere. If it is weak (see below), then MORE 14C is generated.
Formation: 14N + neutron => 14C + proton Decay: 14C => 14N + b- + a neutrino
So – if the magnetic field was WEAKER than present, more 14C would have been produced then, and more would still be around (in the corals) now. This would make the corals appear YOUNGER than they are.
This means that you have to correct 14C dates for the changes in the geomagnetic field. If you do this, then 14C is a reliable dating technique.
Compiled record of temperatures in Northern Europe, including tree-ring data, black line is ‘instrumental’ records, growing (vineyard) seasons.
The Holocene Climate Optimum at 8000 yrs. It’s been warmer recently