Download
1 / 39
390 likes | 540 Views
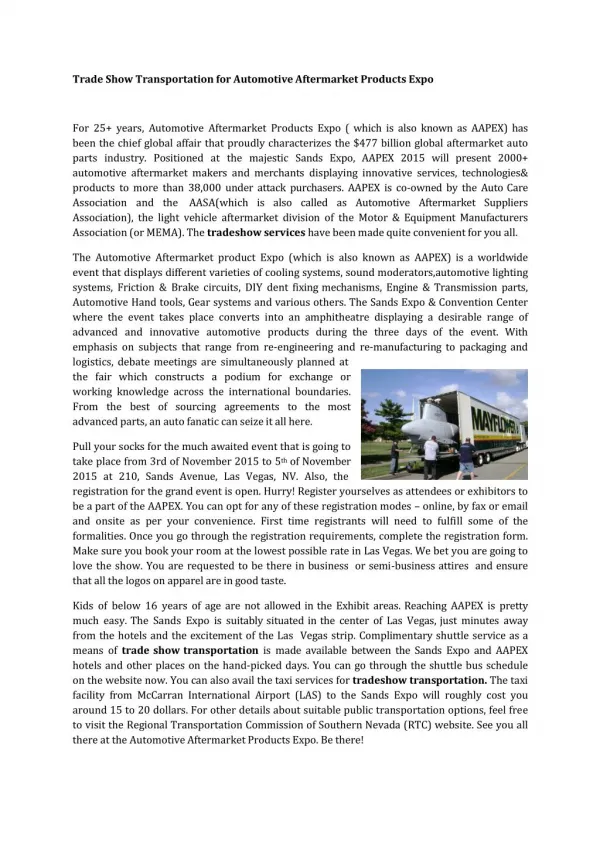
The UK Automotive Scene Supplementary data for Auto Expo 2012. UK Market Overview - 1. 31 key vehicle manufacturing sites: seven volume passenger car, 11 commercial vehicle, bus, coach and taxi manufacturers. Global base for engine manufacture, 2.3m. in 2010.

E N D
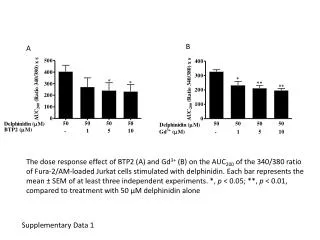
The UK Automotive Scene Supplementary data for Auto Expo 2012
UK Market Overview - 1 31 key vehicle manufacturing sites: seven volume passenger car, 11 commercial vehicle, bus, coach and taxi manufacturers. Global base for engine manufacture, 2.3m. in 2010. 19 of the world’s top 20 industry suppliers and 7 global volume vehicle manufacturers located in UK. Motor sport cluster for development and manufacture: eight F1 teams supported by >300 specialist motorsport companies. Many foreign vehicle manufacturers now have UK-based R&D centres: Nissan at Cranfield; Ford at Dunton; SAIC at Longbridge; Changan at Nottingham; TATA at Warwick. – and Jaguar-Land Rover • Creation of UK Automotive Council – framework for collaboration with Government to improve the UK investment offer and positioning of UK as centre for ultra low carbon development.
UK Market Overview - 2 • Majority of UK automotive manufacturing foreign-owned. • Mature market, 4th largest car producer in EU*. • Exports average >£25 billion annually, over 10% of UK exports. • 2010 car production nearly 1.3mn, up from <1m in 2009 recession; exports have increased from c65% 2000 to >75% in 2010. Commercial vehicle production consistently > 200,000 between 2004-8, but just 90,000 in 2009 (not supported by scrappage scheme). 2010 production back to c123,000, with exports c70%. • UK had fourth highest R&D spend in Europe at over £1.5 billion p.a. • * Source OICA
UK Market Overview - 3 SMMT 12th Annual Sustainability Report 18 signatory companies - across the broader industry, shows year on year: Manufacturing turnover up 20% to £49bn. Output up 27.8%, returning to pre-recession volumes. Number of vehicles exported up 31%, totalling £29bn in value. Energy use per vehicle produced down 8%. Manufacturing CO2 emissions down 10.5% per vehicle produced. Manufacturing waste to landfill produced per vehicle down 8%. New automotive apprenticeships up 9% adding to the 737,000 jobs dependent on the sector.
Key elements of the sector Strong independent design engineering and testing base. Significant foreign manufacturing investment and R&D investment / spend. Efficient manufacture and high export ratios of both volume and premium / niche vehicles. Strong powertrain sector with technological innovation and scale. Low carbon technology and electric vehicle development and manufacture, with strong government support. Comprehensive OEM aftermarket component manufacture, distribution, service and repair capacity. In depth HE academic study & research and FE sector training. Highly sophisticated retail and distribution logistics import / export services.
UK Production Restructuring, Rebirth, Recession, Recovery Vehicle Production in Millions Years
Long-term commitment to UK – major announcements in 2010-11 BMW: £500m investment across all 3 UK facilities for the 3rd generation MINI; expansion of range to include Coupe and Roadster Minis Ford: 5 year £1.5bn investment in engineering and manufacturing facilities. GM: next generation Vivaro confirmed for Vauxhall’s Luton plant from 2013/4. Honda: commitment to new Civic and CRV, following total £1.4bn investment at Swindon. Nissan: £420m investment to make LEAF and batteries; £192m investment for new Qashqai Tata JLR: retaining three vehicle assembly sites, build new engine factory, widen product range, creating >2,000 new jobs; >£2bn of supply contracts for the Range Rover Evoque; £490mn investment for C-X75 hybrid supercar Tata: establishment and expansion of European Technical Centre. Aston Martin: Cygnet production to create 150 new jobs; Rapide production moving to Gaydon from Austria. McLaren: MP4-12C to be produced in Woking. SAIC MG: MG6 GT to be designed engineered and assembled in Longbridge. Optare: new 1,200 capacity bus manufacturing facility in Yorkshire..
Key issues for the UK automotive industry Economic crisis in Europe, USA, Japan, alongside market decline / overcapacity in some markets. Sustainable Government support? Problems with suppliers’ access to finance. Low cost economy countries / High growth markets – both opportunity and competitive threats. Local supply chain fragmented - erosion “hollowing out”/ overseas head office decision making. Some SMEs lack global trade awareness / global competitiveness / skills and training. Maintaining manufacturing efficiency, investment in UK based design engineering, research and development. Environmental / Low carbon legislation, Alternative fuels, ICE hybrids, Electric vehicles.
Key UK technology opportunities Build and retain capacity in “sticky” technologies , ie: • Energy storage and management • Electric motors and power electronics • Lightweight technologies • CO2 and emissions reduction technology Other key technologies in which UK has potential: • In-vehicle communications and management systems,driver communications; congestion warning systems; navigation; telematics. • Materials; composites and alternative materials / jointing technology • Environmental protection / emissions • Rapid prototyping and manufacturing process improvement.
Changing Dynamics of UK Car Sector Demise of the old UK ‘Big 3’ - Growth of Japanese & BMW UK Vehicle Production in Thousands
UK vehicle manufacturers’ product ranges VOLUME CARS BMW - Mini range, incl. Clubman, Coupe and Roadster Honda - Civic, CR-V & Jazz Jaguar – XJ, XK XF Land Rover - Defender, Discovery, Freelander, Range Rover, Range Rover Sport & Evoque Nissan – Note, Qashqai & Juke (and Leaf electric from 2013) Toyota - Auris, Auris Hybrid & Avensis Vauxhall – Astra COMMERCIAL Alexander Dennis - buses & coaches Dennis Eagle - refuse trucks Ford - Transit van, Transit Minibus Vauxhall – Vivaro van and minibus, plus Renault Trafic versions Leyland Trucks - trucks London Taxis Int - TX4 taxi and hydrogen fuel cell demonstrator Optare - single & double deck buses Wrightbus - buses PRESTIGE / NICHE LOW VOLUME CARS Aston Martin - DB9, Vantage, Virage, Cygnet Bentley – Continental, Mulsanne Caterham - Classic, Super 7 Ginetta- F400, G50EV & G50R road cars & G20, G40, G40 Junior, G50 & Zytek race cars Lotus - Elise, Evora, Exige ; new Elan, Elise & Esprit McLaren Automotive MP4-12C sports car (from 2011) Morgan – Supersports, 4/4 Sport, 4 seater, Plus4, Roadster & Roadster Sport sports cars Rolls Royce - Phantom & Ghost SAIC - MG6 saloon FORMULA 1 McLaren racing Mercedes F1 - formerly Brawn Red Bull Williams F1 Renault F1 Force India Lotus F1 Virgin Racing
Engine manufacture 2.39 million engines manufactured in 2010 (up 16% from 2009). Key manufacturing plants include: Ford, Dagenham & Bridgend 1,640,197 BMW, Hams Hall 385,051 Honda, Swindon 136,658 Toyota, Deeside 114,254 Nissan, Sunderland 105,766 Cummins, Darlington 43,525 VW, (Bentley) Crewe 4,791
UK Design and Engineering Skills Product planning and development. Vehicle conceptualisation and styling. Rapid prototyping services. Manufacturing engineering/feasibility. Structural analysis & vehicle simulation. Vehicle body, chassis, powertrain & trim. Vehicle component development. Electrical and electronics, chip designing. Engine engineering. Testing and validation, homologation. Special training packages (for CAE, CAM).
UK Car Production Car output in 2010 increased 27.1% to 1,270,444 (2009 - 999,460) Nissan highest production at 423,262 – increase of 25% on 2009 Export market is 75.7% of production
UK Commercial Vehicle Production • 2010 production increased by 35.7% at 123,019 vehicles • Vauxhall and Ford = 85.7% of all CV production • Export market is 69.5% of production (2009 77.5%)
Vehicle production – moving annual total Car production rolling year total CV production rolling year total
UK supply chain About 80% of all component types required for vehicle assembly operations can be procured from UK suppliers. The supply chain represents about 40% of the retail price of a passenger car. The UK automotive supply chain typically generates £4.5 - £5bn of added value annually. Around 2,350 UK companies regard themselves as ‘automotive’ suppliers, employing around 82,000 people. It is estimated that every job in a vehicle’s assembly supports 7.5 elsewhere in the economy.
Production Exports / Registration Imports The UK increasingly manufactures cars to export and imports cars to drive 76% production exported - 85% registrations imported % of vehicle production and registrations
UK New Car Registrations In 2010 the car motor parc was 31.14m (2009 31.04m) Diesel market remains strong for lower medium and above Super mini remains UK largest sector purchase (36.4%) MPV and 4x4 SUV market share continues to rise Hybrid and EV demand only slowly increasing and replaces LPG demand – AFV registrations in 2010 were 22,865 – 1.12% market share, of which 167 were Electric vehicles. Ford Fiesta, Vauxhall Astra and Ford Focus top 3 cars Market in 2010 has risen 1.8% to 2.03m vehicles matching 2009 SMMT prediction
November 2011 Registrations - new cars market down - but fuel efficiency better than ever New car demand fell by 4.2% in November to 134,000 units, but was some 5,000 units above forecast. Diesel and alternatively fuelled cars both took record market shares in the November market. Average new car fuel efficiency improved 29.3% in last 10 years, giving the highest ever mpg. New car registrations over the first 11 months of 2011 were down 4.5%, at 1,822,000 units. Market looks set to better full year forecast of 1.923 million units, but caution remains over 2012.
November 2011 Registrations van and trucks market continues upward trend, growing 19.1% Van and truck registrations up 19.1% to 27,187 units in November, rolling year up 18.6% to 300,331. Truck registrations up 21.5% to 4,503 in November month, rolling year up 24.4% to 41,507. Van registrations up 18.6% to 22,684 units in November, rolling year up 17.7% to 258,824.
New car registrations The scrappage scheme helped support volumes. Market down 7.3% to May and set to end 2011 at 1.93 million units. Market stabilised, at lower level New car registrations, 12 month moving annual total 2008 to 2012
New car registrations Scrappage in place May 2009 to March 2010 (with some overhang). Represented almost 15% total sales over that period. Impact of scrappage scheme New car registrations, 2009 to 2011, with scrappage identified (Source SMMT)
Automotive Council – www.automotivecouncil.co.uk A very powerful industry and government partnership Has helped to transform automotive business environment to provide a more compelling investment proposition for related industries; Expanding technology roadmaps for low carbon vehicles and fuels, to help promote the UK as a strong candidate to develop these and other technologies; Developing commodities roadmap helping to develop a stronger and more competitive automotive supply chain; Providing a very strong public voice for the industry to support the value of the industry to the UK and to global partners; Ensuring high level, strategic, continuous conversation between government and the automotive industry in the UK.
Moving to a lower carbon transport network Meeting EU legislation: Average of 144.2g/km in 2010 – 3.5% down on 2009 and 20.3% on 2000. Q1-3 2011 at 138.5g/km, down 4.0% on 2010 and 23.5% on 2000. 130g/km by 2015, the equivalent of 58mpg with a diesel engine and 52mpg in a petrol car. 65% of new cars averaging the 130g/km target by 2012 rising to 100% in 2015. Manufacturers exceeding the targets will be heavily fined per additional gram of CO2 emitted, for every car registered across Europe. Specialist targets for small volume and niche manufacturers.
UK air quality is improving Since 2000 – levels of pollution are falling. New Car - average CO2 emissions have fallen by over 20% - dropping 3.5% in 2010. Diesel engines have contributed to this improvement. A car built today (Euro 5), compared to one built in 2000 (Euro 3) has reduced its CO2 by 13% and emissions of other pollutants by at least: • nitrogen oxides (NOx) 64% • particulates (PM10) 90% • carbon monoxide (CO) 22% Road transport emissions have also been reduced: • nitrogen oxides (NOx) 40%, • particulates (PM10) 30% • carbon monoxide (CO) 60%. Source: Government figures (DfT – Transport Statistics GB)
UK average new car CO2 emissions UK average new car CO2 emissions (Source SMMT)
Car CO2 emissions, parc and distance travelled Reduction despite increase in distance travelled and parc size since 2000. Further declines expected, as distance travelled curbed and efficiency improves. Source DECC/SMMT/DfT
Distribution of market by VED bands Band E (131-140g/km) most common, in 2000 it was Band G (151-165g/km). Band A (<100g/km) share doubled in 2010 and again in 2011. Distribution of the new car market by VED bands (Source SMMT)
UK performance vs European average UK making better progress than EU average. Average new car CO2 emissions across the EU (Source EC)
Existing CO2 Regulations for cars and Vans EU has adopted CO2 Regulations for cars and vans. Individual manufacturer targets add up to deliver EU fleet average target. New car fleet 130g/km in 2015 (19%) 95g/km in 2020 (39%). New van fleet 175g/km in 2017 (14%) 147g/km in 2020 (28%).
Existing CO2 Regulations for cars and Vans Important flexibilities • Targets phased in 2012-15 (cars), 2014-17 (vans). • Derogations for small volume and niche manufacturers: targets consistent with their economic and technological potential. • Eco-innovations, super credits, pooling. Integrated approach includes CO2 based tax, consumer information. (labelling new and used cars, databases), MAC, LRRT, GSI etc.
Outlook for car emissions EU-wide target for 130g/km by 2015 and 95g/km 2020 (subject to IA). Note EU, not UK specific targets. 38.2% of 2010 UK market <130g/km. EU-wide van target - 175g/km by 2014-17 and 147g/km by 2020 (subject to review). UK average new car CO2 emissions and EC wide regulation targets (Source SMMT/EC)
Next Challenge: Heavy Duty Vehicles (HDVs) • HDVs are not yet regulated for CO2 in Europe. • Measurement method is the bottleneck in policy making. Research ongoing, likely to use computer simulation and validate with physical testing. • EU Commission policy development timetable: • February/March 2012 - measurement methodology stakeholder meeting. • May/ June 2012 - draft EU strategy stakeholder meeting. • End 2012 - impact assessment. • First half 2013 - Commission to propose strategy.
Longer Term Strategy for 2030 and 2050 EU ambitions and UK binding targets • EU committed to 20% CO2 cut by 2020 (or 30% if global targets) and 80-95% by 2050. • UK is legally committed to: • Carbon Budgets for each five year period to 2027. • 50% CO2 cut by 2025. • 80% cut by 2050 (both relative to 1990, all sectors) • (Cannot stop there, need more cuts by 2100). • UK government will set out it’s strategy to meet the Carbon Budgets (“Autumn Strategy” due 1 December). • UK Automotive Council technology roadmaps for cars, commercial vehicles, off-highway.
High Level Technology Roadmap - CARS OEMs share a common view (Individual manufacturers will prioritise certain technologies to fit with brand values)
Niche EVs Commercial/Off-Highway EV’s H2 infrastructure Fuel cell vehicles Fuel Cell APUs Demos Plug in hybrid Full hybrid Micro/Mild hybrid Light Duty Cycles Medium Duty Cycles IC Engine efficiency improvements Waste heat recovery Advanced thermodynamic cycles Sustainable liquid/gaseous fuels Biofuels Heavy Duty Cycles Powertrain efficiency improvements/ancillary electrification Intelligent vehicles logistics – operational efficiency (On & Off-highway) Advanced highway vehicle aerodynamics/selective lightweighting • Low carbon Commercial Vehicle & Off-highway roadmap has parallel technology streams depending on duty cycle 2020 2030 2010 2040 2050 Technology Roadmap CO2 reductions limited by air quality regulations “Zero” Air Quality Impact Air Quality Improvements Drivers UK CO2 Target Possible HD/MD CO2 Regulation LD Van CO2 Regulation CO2 and GHG reduction