Download
1 / 30
300 likes | 413 Views
U6 Capture Cross Section with the TAC. Mark Vermeulen. Analysis meeting 2011. Outline. Pulse shape analysis routine. U6 Analysis. Future work. Motivation. Experimental setup. The U6 sample. Analysis so far. Pulse Shape A nalysis R outine. Pulse shape analysis routine.

E N D
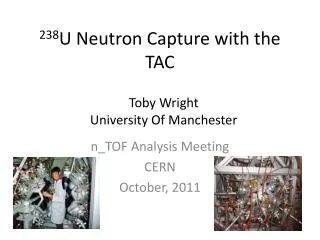
U6 Capture Cross Section with the TAC Mark Vermeulen Analysis meeting 2011
Outline Pulse shape analysis routine U6 Analysis Future work Motivation Experimental setup The U6 sample Analysis so far
Pulse shape analysis routine • Accuracy of final results depends on accuracy of PSA routine. • Basis of turning RAW to DST • Write, test and validate a single, versatile PSA routine that works for SILI, MGAS and PKUP and DIAM detectors. • Reconstruct gamma flash and saturated pulses
Motivation • Th/U Cycle • Nuclear Technology • Site of build up of MA 233Th 233U 236U 235U 232Th 234U 233Pa 237U 234Pa 234Th
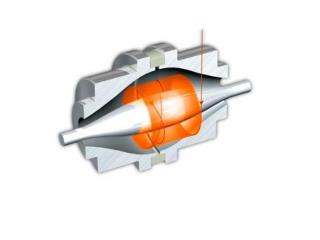
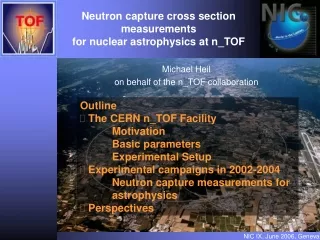
Experimental setup • Measurements made with TAC • 40 BaF2 crystals • Segmented 4πarray • Complete gamma cascade detection • 96% efficiency • Goal: measure up to 20 keV • Total number of protons: 1.5e18
The U6 Sample • 236U3O8 sample • 338 mg of 236U • 99.85% Enriched • U6 Dimensions: 10 x 0.25 mm • Al Canning dimensions: 15 x 0.75 mm • Composition: 0.05% U5 99.85 U6 0.10% U8 • Al canning thickness: 0.5-0.75 mm
Analysis so far… • Gain shift monitored with 88Y calibration source. • 236U, AU, C, empty, beam off, dummy runs. • Background above 20 keV dominated by Al. • Calibrated in energy and time. • Applying cuts to data
Analysis so far… Calibration
Analysis so far… Calibration
Analysis so far… Calibration
Analysis so far… U6… U6 Al canning Empty Beam off Counts/7e12 protons Counts/7e12 protons
Analysis so far… 10B(n,γ)7Li* 40K(β) 1H(n,γ) 236U(n,γ) Counts/7e12 protons 27Al(n,γ) Ba2F > 6 MeV
Analysis so far… U6… Counts/7e12 protons
Analysis so far… U6…
Analysis so far… U6…
Analysis so far… U6…
Analysis so far… U6… 10,000 bins/decade p-wave resonance 5.45 eV resonance
Analysis so far… U6… 10,000 bins/decade U6 RRR limit in ENDF Al canning Empty
Analysis so far… U6 Al canning Empty 100 bins/decade
Analysis so far… Count rate vs. neutron energy
Analysis so far… Count rate vs. neutron energy
Future work • In early stages. • Need to convert all DST’s • Identify all features in plots. • Look for containments. • Look at scattering with carbon runs. • Eliminate all background. • Etc…