Download
1 / 21
210 likes | 319 Views
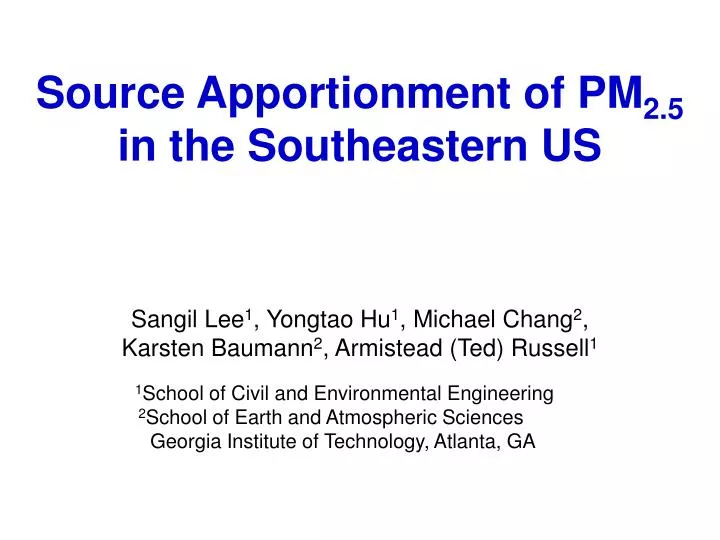
Source Apportionment of PM 2.5 in the Southeastern US. Sangil Lee 1 , Yongtao Hu 1 , Michael Chang 2 , Karsten Baumann 2 , Armistead (Ted) Russell 1 1 School of Civil and Environmental Engineering 2 School of Earth and Atmospheric Sciences

E N D
Source Apportionment of PM2.5in the Southeastern US Sangil Lee1, Yongtao Hu1, Michael Chang2, Karsten Baumann2, Armistead (Ted) Russell1 1School of Civil and Environmental Engineering 2School of Earth and Atmospheric Sciences Georgia Institute of Technology, Atlanta, GA
Concerns • Adverse Health Effects PM mass, chemical composition (sulfate, EC, OC etc), size • Identify PM sources • Understand a relationship between sources and adverse health effects • Develop control strategies of PM
every 3 day every 6 day EPA STN sites • PM2.5 chemical composition (ionic species, OC & EC, trace elements) • covers from January 2002 to November 2003
Primary and Secondary OC Minimum OC/EC ratio approach (Castro et al., 1999) POC + SOC Atlanta, GA SOC = OC - POC Significant Uncertainty ! SOC = OC - (OC/EC)primary x EC
max & min average std SOC and ( Unidentified Mass+OC)/OC • seasonal variability of SOC • positive relationship between SOC and (Uni Mass + OC)/OC Atlanta, GA 44 % SOC (20 % ~ 75 %) at Atlanta, August, 1999 (Lim and Turpin, 2002)
Primary OC/EC Ratios • Lower: major cities (more diesel vehicles) • Higher: others (more biomass burning)
Source Apportionment- CMB Receptor Model - Wood burning: Fine et al. (2002) Motor vehicles: Schauer et al. (1999, 2002) Coal power plant: Chow et al. (2004) Dust, Pulp & Paper, Oil combustion, Metal, Mineral production: EPA SPECIATE 3.2 Ci : ambient concentration of species i fi,j : fraction of species i in source j Sj : source contribution of source j
Interpolation- Inverse Distance Weighted - PM2.5 mass mg/m3
Interpolation- Inverse Distance Weighted - (NH4)2SO4 NH4HSO4 mg/m3 SOC NH4NO3
Interpolation- Inverse Distance Weighted - mg/m3 Wood Burning Motor Vehicles mg/m3 Pulp & Paper Coal Power Plant
Interpolation- Inverse Distance Weighted - Mineral Production Dust mg/m3 Oil Combustion Port Shipping (?) Metal Production
Comparisons with Emission InventoriesSource apportionment Emission mg/m3 PM2.5 Max: 12,465 tons/yr mg/m3 Max: 628 tons/yr Motor Vehicles
Comparisons with Emission InventoriesSource apportionment Emission mg/m3 Max: 1,843 tons/yr Mineral production mg/m3 Pulp & Paper production Max: 1,431 tons/yr
Spatial Correlations of Sources • Which sources are/are not correlated in the region? • Source correlation calculations • Pearson numbers between two sites were calculated for each source based on daily source apportionment results • how daily source correlations are changed with distance
NH4HSO4 + (NH4)2SO4 2= 6.31 Spatial Correlations 2= 4.29 PM2.5 mass
Spatial Source Correlations 2= 8.00 2= 7.72 NH4HSO4 (NH4)2SO4 2= 7.83 2= 6.27 NH4NO3 SOC
Spatial Source Correlations 2= 9.64 2= 11.47 Wood Burning Motor Vehicles 2= 9.72 2= 19.70 Pulp & Paper production Dust
Spatial Source Correlations 2= 7.95 2= 11.58 Metal Production Mineral Production 2= 7.02 2= 9.32 Oil Combustion Coal Power Plant
Summary • SOC : 40 ~ 60 % of OC, Seasonal difference • Secondary PM : more than 50 % of PM • Significant spatial variability of source contributions • Agreement or disagreement with emission inventories • Significant regional correlation; secondary PM, wood burning, motor vehicles, dust • Little regional correlation; industrial sources • Can identify port shipping impacts?
Acknowledgements • Funding Agencies • U.S. EPA (RD82897602, RD83107601, and RD83096001) • GA DNR • Georgia Power