Download
1 / 1
10 likes | 171 Views
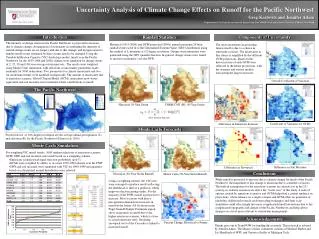
Skill Analysis for Runoff Forecasts on the Western Slope of the Sierra Nevada . B. D. Harrison; R. C. Bales Sierra Nevada Research Institute University of California, Merced (Email: bharrison3@ucmerced.edu). H21C-1189. Introduction. Summary and Correlation Measures of Forecast Skill.

E N D
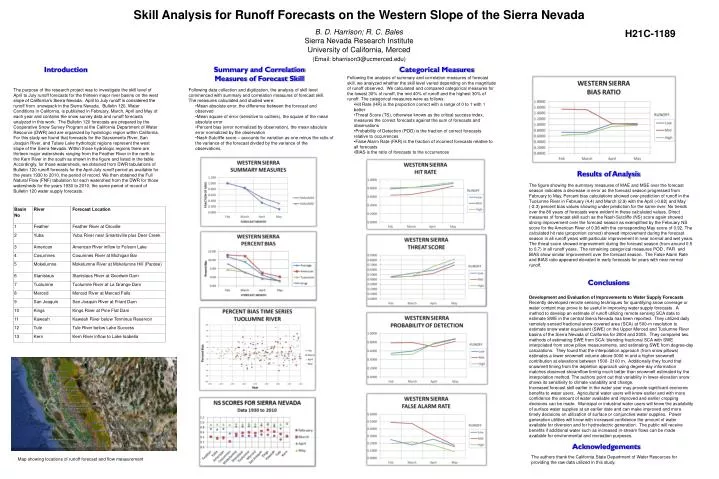
Skill Analysis for Runoff Forecasts on the Western Slope of the Sierra Nevada B. D. Harrison; R. C. Bales Sierra Nevada Research Institute University of California, Merced (Email: bharrison3@ucmerced.edu) H21C-1189 Introduction Summary and Correlation Measures of Forecast Skill Categorical Measures • Following the analysis of summary and correlation measures of forecast skill, we analyzed whether the skill level varied depending on the magnitude of runoff observed. We calculated and compared categorical measures for the lowest 30% of runoff, the mid 40% of runoff and the highest 30% of runoff. The categorical measures were as follows: • Hit Rate (HR) is the proportion correct with a range of 0 to 1 with 1 better • Threat Score (TS), otherwise known as the critical success index, measures the correct forecasts against the sum of forecasts and observations • Probability of Detection (POD) is the fraction of correct forecasts relative to occurrences • False Alarm Rate (FAR) is the fraction of incorrect forecasts relative to all forecasts • BIAS is the ratio of forecasts to the occurrences The purpose of the research project was to investigate the skill level of April to July runoff forecasts for the thirteen major river basins on the west slope of California’s Sierra Nevada. April to July runoff is considered the runoff from snowpack in the Sierra Nevada. Bulletin 120, Water Conditions in California, is published in February, March, April and May of each year and contains the snow survey data and runoff forecasts analyzed in this work. The Bulletin 120 forecasts are prepared by the Cooperative Snow Survey Program at the California Department of Water Resource (DWR) and are organized by hydrologic region within California. For this study we found that forecasts for the Sacramento River, San Joaquin River, and Tulare Lake hydrologic regions represent the west slope of the Sierra Nevada. Within those hydrologic regions there are thirteen major watersheds ranging from the Feather River in the north to the Kern River in the southas shown in the figure and listed in the table. Accordingly, for those watersheds, we obtained from DWR tabulations of Bulletin 120 runoff forecasts for the April-July runoff period as available for the years 1930 to 2010, the period of record. We then obtained the Full Natural Flow (FNF) tabulation for each watershed from the DWR for those watersheds for the years 1930 to 2010, the same period of record of Bulletin 120 water supply forecasts. • Following data collection and digitization, the analysis of skill level commenced with summary and correlation measures of forecast skill. The measures calculated and studied were: • Mean absolute error, the difference between the forecast and observed • Mean square of error (sensitive to outliers), the square of the mean absolute error • Percent bias (error normalized by observation), the mean absolute error normalized by the observation • Nash-Sutcliffe score – accounts for variation as one minus the ratio of the variance of the forecast divided by the variance of the observations. Results of Analysis The figure showing the summary measures of MAE and MSE over the forecast season indicates a decrease in error as the forecast season progressed from February to May. Percent bias calculations showed over-prediction of runoff in the Tuolumne River in February (4.4) and March (2.9) with the April (-0.82) and May (-2.3) percent bias values showing under prediction for the same river. No trends over the 80 years of forecasts were evident in these calculated values. Direct measures of forecast skill such as the Nash-Sutcliffe (NS) score again showed strong improvement over the forecast season as exemplified by the February NS score for the American River of 0.36 with the corresponding May score of 0.92. The calculated hit rate (proportion correct) showed improvement during the forecast season in all runoff years with particular improvement in near normal and wet years. The threat score showed improvement during the forecast season (from around 0.5 to 0.7) in all runoff years. The remaining categorical measures POD , FAR and BIAS show similar improvement over the forecast season. The False Alarm Rate and BIAS ratio appeared elevated in early forecasts for years with near normal runoff. Conclusions Development and Evaluation of Improvements to Water Supply Forecasts Recently developed remote sensing techniques for quantifying snow coverage or water content may prove to be useful in improving water supply forecasts. A method to develop an estimate of runoff utilizing remote sensing SCA data to estimate SWE in the central Sierra Nevada has been reported. They utilized daily remotely sensed fractional snow-covered area (SCA) at 500-m resolution to estimate snow water equivalent (SWE) on the Upper Merced and Tuolumne River basins of the Sierra Nevada of California for 2004 and 2005. They compared two methods of estimating SWE from SCA: blending fractional SCA with SWE interpolated from snow pillow measurements, and estimating SWE from degree-day calculations. They found that the interpolation approach (from snow pillows) estimates a lower snowmelt volume above 3000 m and a higher snowmelt contribution at elevations between 1500- 2100 m. Additionally they found that snowmelt timing from the depletion approach using degree-day information matches observed streamflow timing much better than snowmelt estimated by the interpolation method. The authors point out that variability in lower-elevation snow shows its sensitivity to climate variability and change. Increased forecast skill earlier in the water year may provide significant economic benefits to water users. Agricultural water users will know earlier and with more confidence the amount of water available and improved and earlier cropping decisions can be made. Municipal or industrial water users will know the availability of surface water supplies at an earlier date and can make improved and more timely decisions on utilization of surface or conjunctive water supplies. Power generation utilities will know with increased confidence the amount of water available for diversion and for hydroelectric generation. The public will receive benefits if additional water such as increased in-stream flows can be made available for environmental and recreation purposes. Scope Rivers. Acknowledgements The authors thank the California State Department of Water Resources for providing the raw data utilized in this study. Map showing locations of runoff forecast and flow measurement