Download
1 / 26
270 likes | 462 Views
Development Research Center of the State Council, P.R.C. China ’ s Investment & Trade Environment. Yingmin Liao China-Chile International WorkshopSantiago, Chile June 9, 2004. Main contents. I. Overview of FDI in China

E N D
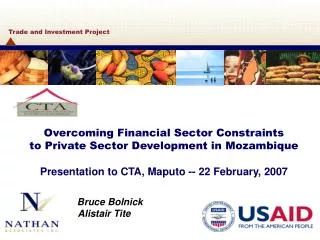
Development Research Center of the State Council, P.R.C China’s Investment & Trade Environment Yingmin Liao China-Chile International WorkshopSantiago, Chile June 9, 2004
Main contents I. Overview of FDI in China II. Overview of China’s Import & Export III. China’s Investment &Trade Policies IV. China’s Investment & Trade Environment
FDI has witnessed a rapid increase over last 20 years since China adopted the policy of reform and opening to the outside world in 1978 and its entry into WTO in 2001. In 2002,The realized volume of FDI was $ 52.74 billion, whereas contracted FDI amounted to $ 82.768 billion,which made China firstly become the largest FDI recipient in the world. Figure 1 China's FDI inflows 600 535.1 527.4 468.8 500 454.6 452.6 417.3 407.2 400 337.7 275.1 300 200 110.1 100 31.9 6.4 0 1983 1988 1992 1993 1994 1996 1997 1999 2000 2001 2002 2003 $ 100 million
FDI in China by industry At present, more than 400 companies of Fortune 500 have entered China. MNCs have established more than 150 R & D or technical centers, and four fifth of newly-invested projects have adopted the most advanced technology of the parent companies.
Table 1 Industries with investment by registered foreign enterprises ( Dec. 31, 2002) Registered enterprises Total investment Foreign registered capital number Industry structure(%) volume($ 100 million ) Industry structure (%) ) volume($ 100 million ) Industry structure(%) Total 208056 100.00 100.00 402000 100.00 981893 Farming, forestry, animal husbandry and fishery 4640 2.23 10371 1.05 5220 1.29 Mining industry 957 0.45 3658 0.37 1691 0.42 Manufacturing 146515 70.42 572761 58.33 248296 61.76 Power, gas and water 1185 0.56 53898 5.48 12025 2.99 Construction industry 4197 2.01 22937 2.33 7860 1.95 Transportation, storage ,Post and Telecommunications Services 3540 1.71 44588 4.54 16962 4.21 Wholesale, retail , Hotel and catering service , 12431 5.97 26294 2.67 11689 2.90 Real estate 11850 5.69 148033 15.07 51865 12.91
In 1990, enterprises with foreign investment had a gross industrial output value of 44.895 billion RMB,occupying about 2.28% of the national total industrial output value of 1970.1 billion RMB. In 2002, foreign-invested enterprises had a gross industrial output value of 3377.1 billion RMB,accounting for about 33.37% of total industrial value of 10119.8 billion RMB Figure 2Industrial output value of enterprises with foreign Investment vs. national industrial output value 1990-2002 150000 100000 50000 0 2001 1990 1991 1992 1993 1994 1995 1996 1997 1998 1999 2000 2002 Industrial output value Of enterprises with Foreign investment (100 million RMB) National industrial output value (100 million RMB)
In 1990, the total value of import and export by foreign-funded enterprises in China reached $ 20.1 billion,accounting for about 4.04% of the total value of $115.4 billion for China’s import and export.In 2002, the total value of import and export by foreign-funded enterprises in China was $ 330.2 billion, occupying about 53.19% of the total value of $620.8 billion for China’s import and export.
Figure 3 Total value of import and export commodities by foreign-funded enterprises vs. total value of national import and export commodities in China:1990-2002 7000 6000 5000 4000 3000 2000 1000 0 1990 1991 1992 1993 1994 1995 1996 1997 1998 1999 2000 2001 2002 Total value of Import & Export commodities by foreig-funded enterprises ($ 100 million) National import and export commodities ($ 100 million)
In1990, the total value of import and export of China was $ 115.4 billion. Out of that, the value of export was $ 62.1 billion and the value of import was $ 53.4 billion with a trade surplus of $ 8.7 billion. In2003, the total value of import and export of China was $ 851.2 billion. Out of that, the value of export was $ 438.9 billion and the value of import was $ 412.8 billion with a trade surplus of $ 25.5 billion. Figure 4 Overview of China International Trade:1990-2003 9000 8000 7000 6000 5000 4000 3000 2000 1000 0 1990 1991 1992 1993 1994 1995 1996 1997 1998 1999 2000 2001 2002 2003 Import ($ 100 million) Import & Export ($ 100 million) Export ($100 million)
2. 2003年主要进口商品 表2 2003年主要进口商品 表2 2003年主要进口商品 Item of commodities Unit 2003 2002 Year-on-year(%) Integrated circuit and micro electronic elements million 47893 34440 39.1 Steel 10000ton 3717 2449 51.8 Crude oil 10000 ton 9112 6941 31.3 Automatic data processing equipment spares ton 211432 18362 15.1 Automatic Data Processing equipment components 10000set 20287 11497 76.7 TV,Radio $ telecommunication spares ton 142431 47341 200.9 Unforged copper 10000ton 262 225 16.5 soybeen 10000ton 2074 1131 83.3 Auto and auto chassis car 172339 12736 35.3 Iron ore in sand form & concentrate 10000ton 14813 11149 32.9 Figure 2 Major imported commodities in 2003
The Commodity Composition of Import(2003) Foodstuff,live poultry,tobacco 2% Non-foodstuff material 8% The rest 9% Mineral fuel,lubricant oil 7% Chemical products Machinery Transportation Equipment 47% 12% Finished products categorized By raw materials 15%
Bilateral Trade between China and Chile In 2003, the total value of China’s trade with Chile was $3.5 billion an increase of 37.5%year-on-year. The value of export to Chile was $1.28 billion USD, an increase of 28.6%, and the value of import from Chile was $2.24 billion, an increase of 43.2%。China’s trade deficit was $ 0.96 billion. In 2003,China imported 500 thousand tons of copper from Chile, which accounted for near twenty percent of total import from Chile.
1. China will fulfill it Commitments to WTO and open its market wider In line with China’s WTO commitments, China reduced its average tariff rate from 11% in 2003 to 10.4%, in which the average tariff rate of agricultural product was lowered from 16.8%to15.6% and industry products from 10.3% to 9.5%。 From January 1, 2004, China eliminated import quotas on refined petroleum products, natural rubber and tyres and eliminated the import quotas on certain tax numbers of motor vehicles and key parts. In 2004, five commodities with 123 commodity codes (8 number) are imposed of import quotas or licenses. Motor vehicles and key parts are in line with import quotas and licensed import commodities are :DVD production equipment, monitored chemicals, easy-made poisonous chemicals and materials damaging the ozone layer.
China’s Commitments to WTO (to be continued) In 2004, fifty kinds of commodities are imposed of export quota licenses which are maize, rice, cotton, tea, saw lumber, live cattle (to Hong Kong & Macao), live pigs (to Hong Kong & Macao), live chicken (to Hong Kong & Macao), silk, coal, charcoal, crude oil, refined oil, rare-earth, etc. According to China’s WTO commitments,China will eliminate import quota on motor vehicles from January 1, 2005 and will continue to lower tariff tax on motor vehicles till July 1, 2006 when the tariff tax is reduced to 25% for the complete vehicle.
2. More fields will be open to foreigninvestment and more ways will be adopted for FDI utilization In March 2002, the central government enacted the New Industrial Guidance Catalogue on Foreign Investment, and sectors such as telecommunications, construction and operation of urban water supply and sewage, gas and thermal energy supply networks that were prohibited previously are now open to foreign investment.Of a total of 371 items under the new catalogue, 75 items fall into the restricted category - a substantial reduction from 112 items under the old catalogue, others are encouraged or permitted. ON April 12, 2003, Temporary Rules for Foreign Investors to Buy Enterprises inside China was brought into effect,which allowed foreign investors to buy enterprises inside China through M&A.
On Nov.5, 2002,China issued the Tentative Rules on Administration of Investment in Domestic Securities by Qualified Foreign Institutional Investors, with the purpose to open up Chinese domestic securities market to QFII(Qualified Foreign Institutional Investors). By the end of Nov. 2003,Chinese authorities had approved ten QFII s’ scheme with a total investment of $1.75 billion. On June 1, 2004, Measures on the Investment in the Commercial Field by Foreign Investors was brought into effect,which means that foreign investors can enter into commercial field, with lower threshold than before, such as registered capital, investment scale etc.
3. Encourage Technical Development & Innovation by Foreign-Funded Enterprises From 1998, China strengthened the work of encouraging technical development & innovation by foreign-funded enterprises: foreign-fund R&D center can be exempt from tariff and VAT when importing self-use equipment or its related technique and spare parts;foreign-funded entities that engage in know-how transfer, technological development, or related technical consulting and other services can be free from business tax;foreign-funded entities that engage in know-how transfer, technological development, or related technical consulting and other services can be free from business tax;if the technological development spending in foreign-funded enterprise increases more than 10% over the previous year, 50% of the implemented capital can be used to offset the taxable income at the approval of tax authority; domestically made equipment purchased by the enterprise without exceeding total investment can get the refund for VAT if the same import equipment is free from duty.
4.Encourage foreign investors to invest in central and western China The newly issued Industrial Guidance Catalogue on Foreign Investment in Middle and Western China indicated that the foreign-funded entities can be exempt from tariff and VAT when importing self-use expertise, equipment and spare parts, that foreign funded enterprises established in middle and western China can enjoy extended income tax exempt duration.
1.Advantageous investment environment High growth rate of economy: GDP of China grew at an average rate 9.3% per year from 1979 to 2003; Stable political and social climate; Low labor cost: average money wage was $ 1696 in 2003; Value of industry product created by foreign funded enterprises grew at the rate 43.33% per year from 1990 to 2002
Production Consumption Net import soybean 1620 3460 2074 Rolled steel 24000 27000 3000 Iron ore 14800 Rolled copper 177.2 204.3 133.3 Copper ores 58.3 138.4 80.1 Crude oil 17000 25299 8299 2. Huge potential consuming market China is an immense production and consume country. In 2003, total retail sale of consumer goods was $ 553 billion, total sales of enterprise above designated size in wholesale and retail trade is $1152 billion. Demand of resource commodities grows dramatically Table 3 Supply & demand of major products in 2003 (ten thousand tons) * consumption = production + net import
3. Infrastructure being improved • For recent years, the country strengthened to build out infrastructure to improve condition for business, like new highways, power plants and phone networks. By the end of 2003, electricity production was 1910.8 billion kwh, total business length of railway transportation was 730,000 kms, highway was 1.81million kms,volume of freight handled in major coastal ports was 2.01 billion tons. • According to a survey by the World Bank, it takes 8 days for a Chinese enterprise to claim its commodity through customs clearance from sea ports which is about the same time length with South Korea and Thailand. Compared with that, it takes India 11days and Pakistan 18days.