Download
1 / 1
10 likes | 140 Views
T. Mizuno (Hiroshima University), T. Kamae, H. Tajima, T. Handa, T. Lindner (SLAC), H. Mizushima, S. Ogata, Y. Fukazawa (Hiroshima University), M. Ozaki (ISAS), P. Valtersson, M. Roterman, N. Karlsson (Royal Institute of Technology and SLAC), H. Kelly (GSFC) and GLAST BFEM team. Flight Operation:.

E N D
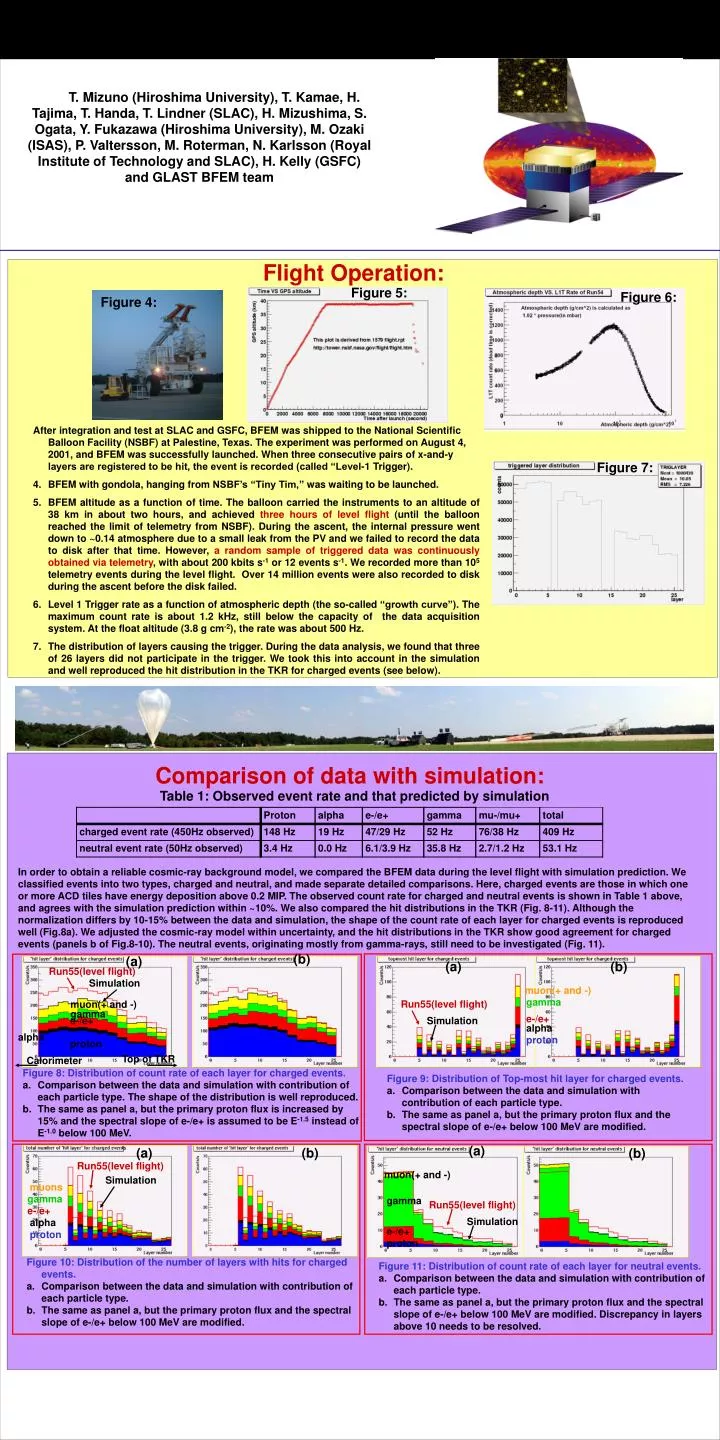
T. Mizuno (Hiroshima University), T. Kamae, H. Tajima, T. Handa, T. Lindner (SLAC), H. Mizushima, S. Ogata, Y. Fukazawa (Hiroshima University), M. Ozaki (ISAS), P. Valtersson, M. Roterman, N. Karlsson (Royal Institute of Technology and SLAC), H. Kelly (GSFC) and GLAST BFEM team Flight Operation: Figure 5: Figure 6: Figure 4: • After integration and test at SLAC and GSFC, BFEM was shipped to the National Scientific Balloon Facility (NSBF) at Palestine, Texas. The experiment was performed on August 4, 2001, and BFEM was successfully launched. When three consecutive pairs of x-and-y layers are registered to be hit, the event is recorded (called “Level-1 Trigger). • BFEM with gondola, hanging from NSBF’s “Tiny Tim,” was waiting to be launched. • BFEM altitude as a function of time. The balloon carried the instruments to an altitude of 38 km in about two hours, and achieved three hours of level flight (until the balloon reached the limit of telemetry from NSBF). During the ascent, the internal pressure went down to ~0.14 atmospheredue to a small leak from the PV and we failed to record the data to disk after that time. However, a random sample of triggered data was continuously obtained via telemetry, with about 200 kbits s-1 or 12 events s-1. We recorded more than 105 telemetry events during the level flight. Over 14 million events were also recorded to disk during the ascent before the disk failed. • Level 1 Trigger rate as a function of atmospheric depth (the so-called “growth curve”). The maximum count rate is about 1.2 kHz, still below the capacity of the data acquisition system. At the float altitude (3.8 g cm-2), the rate was about 500 Hz. • The distribution of layers causing the trigger. During the data analysis, we found that three of 26 layers did not participate in the trigger. We took this into account in the simulation and well reproduced the hit distribution in the TKR for charged events (see below). Figure 7: Comparison of data with simulation: Table 1: Observed event rate and that predicted by simulation In order to obtain a reliable cosmic-ray background model, we compared the BFEM data during the level flight with simulation prediction. We classified events into two types, charged and neutral, and made separate detailed comparisons. Here, charged events are those in which one or more ACD tiles have energy deposition above 0.2 MIP. The observed count rate for charged and neutral events is shown in Table 1 above, and agrees with the simulation prediction within ~10%. We also compared the hit distributions in the TKR (Fig. 8-11). Although the normalization differs by 10-15% between the data and simulation, the shape of the count rate of each layer for charged events is reproduced well (Fig.8a). We adjusted the cosmic-ray model within uncertainty, and the hit distributions in the TKR show good agreement for charged events (panels b of Fig.8-10). The neutral events, originating mostly from gamma-rays, still need to be investigated (Fig. 11). (b) (a) (a) (b) Run55(level flight) Simulation muon(+ and -) gamma Run55(level flight) muon(+ and -) gamma e-/e+ Simulation e-/e+ alpha alpha proton proton Top of TKR Calorimeter • Figure 8: Distribution of count rate of each layer for charged events. • Comparison between the data and simulation with contribution of each particle type. The shape of the distribution is well reproduced. • The same as panel a, but the primary proton flux is increased by 15% and the spectral slope of e-/e+ is assumed to be E-1.5 instead of E-1.0 below 100 MeV. • Figure 9: Distribution of Top-most hit layer for charged events. • Comparison between the data and simulation with contribution of each particle type. • The same as panel a, but the primary proton flux and the spectral slope of e-/e+ below 100 MeV are modified. (a) (a) (b) (b) Run55(level flight) muon(+ and -) Simulation muons gamma gamma Run55(level flight) e-/e+ Simulation alpha e-/e+ proton proton • Figure 10: Distribution of the number of layers with hits for charged events. • Comparison between the data and simulation with contribution of each particle type. • The same as panel a, but the primary proton flux and the spectral slope of e-/e+ below 100 MeV are modified. • Figure 11: Distribution of count rate of each layer for neutral events. • Comparison between the data and simulation with contribution of each particle type. • The same as panel a, but the primary proton flux and the spectral slope of e-/e+ below 100 MeV are modified. Discrepancy in layers above 10 needs to be resolved.