Download
1 / 23
230 likes | 383 Views
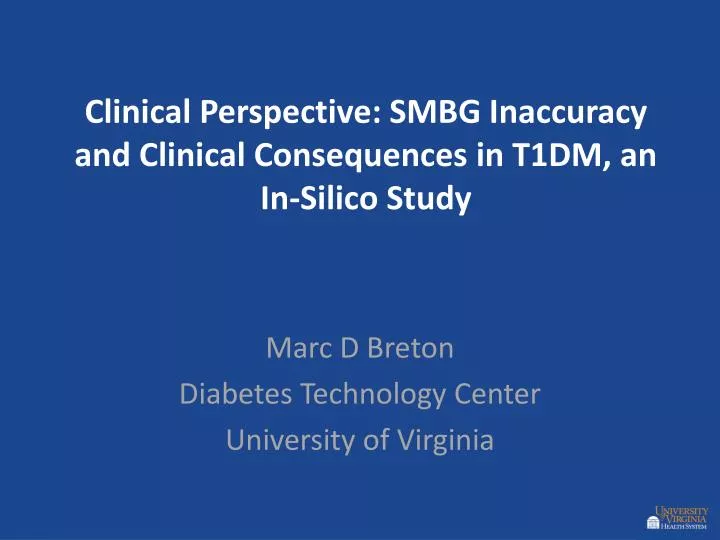
Clinical Perspective: SMBG Inaccuracy and Clinical Consequences in T1DM, an In-Silico Study. Marc D Breton Diabetes Technology Center University of Virginia. Background.

E N D
Clinical Perspective: SMBG Inaccuracy and Clinical Consequences in T1DM, an In-Silico Study Marc D Breton Diabetes Technology Center University of Virginia
Background • All type I diabetics as well as many type II are encouraged to pursue strict glycemic control to avoid chronic complications. All face the challenge to lower glucose levels while avoiding hypoglycemia. • Accurate information about the patient’s status is needed to achieve such goals. At this time SMBG are the main source for such information, and the only one that can be repeated frequently.
Does SMBG accuracy have a clinical impact • “when examining blood glucose monitor performance in the real world, it is important to consider if an improvement in analytical accuracy would lead to improved clinical outcomes for patients” [Clarke 2010] • Miscoding meters can result in significant meter bias and increase risk for hypoglycemia [Raine et al 2008]. • Clinical outcome studies are difficult to design as controlled administration of meter errors in vivo is intricate and sometime unethical. • A viable alternative has been presented in Bruns and Boyd landmark work which made use of computer simulations to asses the influence of meter errors on insulin dosing.
www.flightgear.org Use of Simulations: example design of the Boeing B787
In silico pre-clinical experiments. How to build a Simulator of Glucose/Insulin Dynamics in Man • Mathematical models based on clinical knowledge; • Accumulation of data targeting specific subsystems; • Identification of physiological processes (fluxes); • Creating in silico subjects; • Assessment of inter-subject variability (creating in silico population); • Software implementation (currently MATLAB); • Validation of the simulations against in vivo data.
Simulated Measurement • YSI/Beckman • SMBG • CGM 180 160 140 120 100 80 60 0 60 120 180 240 300 360 420 Simulated Insulin Delivery • IV • SQ pump 500 400 300 200 100 0 0 60 120 180 240 300 360 420 Mathematical Models Based on Clinical Knowledge Glucose-Insulin Model in T1DM (Dalla Man & Cobelli, 2006, 2007); Model of Sensor Errors (Breton & Kovatchev, 2008). In Silico Subject Glucose- Insulin Model Meal GASTRO-INTESTINAL TRACT Plasma Glucose Treatment LIVER MUSCLE AND ADIPOSE TISSUE GLUCOSE SYSTEM BETA CELL INSULIN DELIVERY Plasma Insulin
Data Accumulation Approximately N=350 individuals pooled from several studies using triple-tracer protocols which, in addition to concentrations, gave access to fluxes: Database AgnetaSunehag (Houston): OGTT in 11 adolescents (age=15±1 yr, mean ± SD) SI= 14.96 ± 10.09 10^-4 dl/kg/min per μU/ml Database Kenneth Polonsky (St. Louis): OGTT in 10 healthy adults SI= 10.89± 4.12 10^-4 dl/kg/min per μU/ml Database Robert Rizza (Mayo Clinic, Rochester): Meal in 204 adults SI= 14.5 ± 9.59 10^-4 dl/kg/min per μU/ml Database E. Baumann & R. Rosenfield (Chicago): OGTT in 27 PrePubertal (PP, age~8 yr); 17 EarlyPubertal (EP, age~ 12 yr); 26 LatePubertal, (LP, age~ 19 yr); 52 Adult (AD, age ~43 yr) SIPP= 19.57± 11.66 10^-4 dl/kg/min per μU/ml SIEP= 7.36± 7.12 10^-4 dl/kg/min per μU/ml SILP= 9.50± 9.60 10^-4 dl/kg/min per μU/ml SIAD= 10.08± 7.92 10^-4 dl/kg/min per μU/ml
Identification of Physiological Processes (Fluxes) Production Glucose Insulin 2.5 600 250 500 Data 2 200 Range 400 (mg/kg/min) 1.5 (pmol/l) (mg/dl) 300 150 1 200 100 0.5 100 0 50 0 0 60 120 180 240 300 360 420 0 60 120 180 240 300 360 420 0 60 120 180 240 300 360 420 Secretion Utilization Rate of Appearance 14 16 12 14 12 10 12 10 8 (pmol/kg/min) 10 (mg/kg/min) (mg/kg/min) 8 8 6 6 6 4 4 4 2 2 2 0 0 0 0 60 120 180 240 300 360 420 0 60 120 180 240 300 360 420 0 60 120 180 240 300 360 420 t (min) t (min) t (min)
Creating an In-Silico Patient An in silico subject is a complex entity of 26 individual parameters. When we run control, we don’t know in advance how such a “subject” would react. meal Qgut Qst2 Qst1 Gsc Gp EGP Gt Uid Id Et Uii I1 X Il Ip insulin Isc1 Isc2
Rate Constant of Liver Insulin Action Liver Insulin Sensitivity Liver Glucose Effectiveness 100 100 100 80 80 80 60 60 60 40 40 40 20 20 20 0 0 0 0.001 0.011 0.022 0.032 0.043 0.064 0.053 0.000 0.003 0.006 0.009 0.012 0.015 0.018 0.011 0.022 0.032 0.043 0.064 0.053 min^-1 mg/kg/min/(pmol/l) min^-1 Rate Constant of Peripheral Insulin Action Peripheral Insulin Sensitivity Peripheral Glucose Effectiveness 100 100 100 80 80 80 60 60 60 40 40 40 20 20 20 0 0 0 0.00 0.03 0.06 0.09 0.12 0.15 0.18 1.25 1.45 1.65 1.86 2.06 2.26 0.00 0.03 0.05 0.07 0.09 0.11 0.13 mg/kg/min per pmol/L mg/kg min^-1 Creating an In-Silico Population The parameters of the in silico “population” must cover well key parameter distributions observed in vivo, thus providing comprehensive analysis of control performance.
Validation and Regulatory Acceptance • Validation: For any in vivo glucose trace, is there is a simulated “subject” or “subjects” who would have a similar trace under the same conditions? • Traces from hyper-insulemic clamp in adults with T1DM, NIH/NIDDK study RO1 DK 51562. • Traces from children with T1DM, DirectNet • Accepted by FDA in January 2008 as a replacement for pre-clinical trials in closed loop studies. • Has been used as the foundation of several Investigational Devices Exemption applications (3 at UVa)
The current In-Silico Population • N=300+30 Simulated Subjects that Can Be: • Screened & measured; • “Admitted” to the CRC and subjected to tests, such as oral glucose tolerance test; • Individual parameters can be derived and used to initialize the control algorithm. Biometric Characteristics of the Population of In Silico “Subjects”
Model of zero bias SMBG errors • We use the ISO format: i.e. fixed relative error over 75 mg/dl and fixed error below. • We experiment with four levels of accuracy: 5% - 4mg/dl, 10% - 8mg/dl, 15% - 11mg/dl, and 20% - 15mg/dl which is the current ISO standard 400 350 95% 300 250 Meter BG [mg/dl] Meter BG [mg/dl] 200 150 100 50 50 100 150 200 250 300 350 400 Reference BG [mg/dl] Reference BG [mg/dl]
Detection of hypoglycemia 5% - 4mg/dl 15% - 11mg/dl 10% - 8mg/dl 20% - 15mg/dl 50% 45% 40% 35% 30% Probability of Missing Hypoglycemic Event 25% 20% 15% 10% 5% 0% 70 68 66 64 62 60 58 56 54 52 50 True Plasma Glucose [mg/dl]
Treatment of hyperglycemia: method • We use the previously described simulator and SMBG error model. • Each in-silico patients starts the experiment stable at 200 mg/dl • For each patient, a perfect bolus is computed that brings the patient at exactly 100 mg/dl within 4 hours. • At time 0 glucose is measured using a simulated SMBG and a bolus is computed using the optimal patient correction factor. • 100 adults in-silico patents are tested 10 times per level of error (i.e. 40 times total) 200 100 0h 2h 4h
Treatment of Hyperglycemia: results 140 120 100 Minimum glucose concentration attained [mg/dl] 80 60 40 5% 10% 15% 20%
SMBG induced glucose variability: method • Each in-silico patients starts the experiment fasting at 100 mg/dl. • At time 0 glucose is measured using a simulated SMBG and a bolus is computed using the optimal patient correction factor and carbohydrate ratio (built in the simulator) so as to cover 60% of the meal, so as to necessitate a correction later on. • 2 hours later a second measure is taken and a correction bolus is computed based on the patient optimal correction factor. • 100 adults in-silico patents are tested 10 times per level of error (i.e. 40 times total) 200 100 0h 2h 4h
SMBG induced glucose variability: method 400 White: 5% -- Black: 20% 305 95% 82 300 higher 95% confidence bound [mg/dl] • Decrease in accuracy augments patient’s risks: • At 5% error: 3% unsafe • At 20% error: 6% unsafe • Decrease in accuracy augments glucose variability (spread of the cloud of points) 180 110 110 90 70 50 lower 95% confidence bound [mg/dl]
Long term effect of SMB accuracy: method • Each in-silico patient is stabilized at a nominal level using their optimal carbohydrate ratio, correction factor and perfect knowledge of glucose level. • The patient’s nominal risk for hypoglycemia is recorded. • Each patient is then studied for 10 simulated days during which their control is based on the SMBG model previously described. • In some subject SMBG errors caused an increased risk of hypoglycemia, and we dialed the risk back to its nominal value. • Limiting the risk of hypoglycemia can cause an increased average glucose, reflecting the detrimental effect of hypoglycemia on glucose control observed in vivo. • This rise in average glucose is transformed into an increase in HBA1c using the ADA formula: 28.7*A1c-46.7=G
Conclusion • In Silico experiments allow for fast and inexpensive study of clinical consequences of SMBG accuracy. • Hypoglycemic events of 60mg/dl are missed 10 times more often when using SMBG with 20% accuracy vs. 10% • The risk of hypoglycemia after the treatment of mild hyperglycemia is practically inexistent up to an error level of 10% and rises with the magnitude of SMBG errors. • Glucose variability post meal increase with SMBG errors • Long term glucose control is affected by SMBG accuracy (+0.4% HbA1c at 20% vs nominal), under the hypothesis of a fixed risk for hypoglycemia.
Essentially, all models are wrong, but some are useful George E.P. Box
Acknowledgement • Diabetes Technology Society, Dr David Klonoff • Dr Boris Kovatchev, UVa • Dr David Bruns, Dr James Boyd, UVa • The Diabetes Technology Center at UVa • Juvenile Diabetes Research Foundation