Download
1 / 14
140 likes | 239 Views
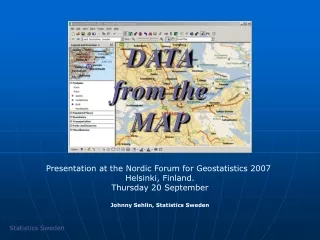
MAP Fall Data Analysis. a professional learning communities activity. Purpose of the MAP Data Analysis. Hands-on interaction with data allows teachers to better understand their reports Identifies students in need of interventions Identifies students on track for College and Career Readiness

E N D
MAP Fall Data Analysis a professional learning communities activity
Purpose of the MAP Data Analysis • Hands-on interaction with data allows teachers to better understand their reports • Identifies students in need of interventions • Identifies students on track for College and Career Readiness • Identifies strengths and areas for improvement • classrooms • grade levels • Identifies school-wide trends
Universal Instructional Expectations • Designing instruction based on student need (2) • Using assessment as a tool to guide instruction (6) • Collaborating with colleagues with the expressed purpose of developing instructional practices to impact student success (12)
Why Use MAP Data? • Aligned to Common Core Standards • Equal Interval RIT scale allows for comparisons between grade levels and test events
The Activity Grades K-1 Grades 2-3
Key Terms • Mean: the average score calculated by adding the scores of each student in your class and dividing by the total number of students. Though easy to calculate and commonly understood, the mean can be misleading simply because it includes all scores from extreme highs through extreme lows. • Median: the middle score as shown by listing each student's score in sequential order. Compensates for extremely high and low scores by focusing only on the middle score. When we start examining your classroom's growth over time, we will be using the median scores with the understanding that moving the middle score over time implies the vast majority of students are improving. • Standard Deviation: the spread of your students' scores, Viewed as a bell curve, the larger the standard deviation the more broad the bell curve becomes. A standard deviation greater than 10 implies a greater need for differentiated instruction. • Standard Error: allows for a possible range in a student's score. A standard error of 3 is typical and would create a RIT Range of 197-203 given an overall RIT of 200. This calculation reasons that if a student were to test again in the near future they would have a high probability of receiving the same score plus or minus the standard error. Standard error is important when discussing student growth and identifying strengths and areas for improvement. Strong indicators for each of these occur when scores are measured outside the range of standard error, or in this case, more than plus or minus 3. • Learning Strand/Goal Performance Area: The categories of skills displayed on NWEA reports as found in the Common Core Standards.
The Individual Analysis Questions • Identify students whose RIT scores fall below the 25th percentile? • Identify students whose RIT scores are above the 65th percentile? • Compare the standard deviations…which strands are in greatest need of differentiated instruction? • Is there a goal area that is 3 RIT points or more higher than the class mean RIT? • Is there a goal area that is 3 RIT points or more lower than the class mean RIT?
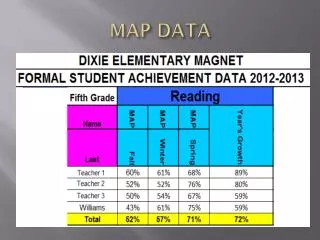
Grade Level Analysis Questions • Calculate the grade level’s median RIT. 210 +212+206= 628 628 / 3 = 209.3 • Calculate the grade level’s average percentage of students likely to meet College and Career Readiness. Will be used to track growth over time • Use your answers to questions 2 and 7. Add the percentage for each subject and divide by the total number of teachers.
Grade Level Discussion Questions • To be completed before the whole-school data activity • Asks grade levels to discuss: • what topics are being taught in the coming weeks • what learning targets are being addressed • how these targets relate to the areas for improvement noted in this data analysis
Whole School Activity • Creates a visual for areas of strength and areas for improvement for the whole school • Teachers must bring their completed analysis with them • Identifies school-wide trends
The MAP Training Wiki • Available through the district website. • Choose the Curriculum Department • The MAP wiki is on the right hand side under Data and Assessment