Download
1 / 16
160 likes | 294 Views
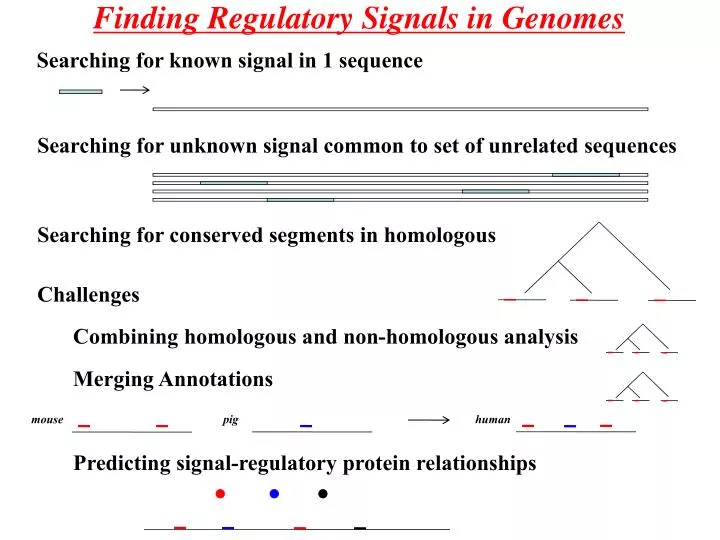
Finding Regulatory Signals in Genomes. Searching for known signal in 1 sequence. Searching for unknown signal common to set of unrelated sequences. Searching for conserved segments in homologous. Challenges. Combining homologous and non-homologous analysis. Merging Annotations. mouse. pig.

E N D
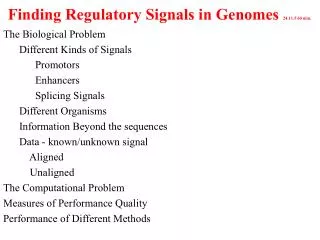
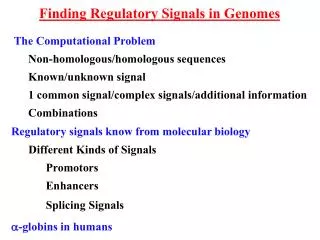
Finding Regulatory Signals in Genomes Searching for known signal in 1 sequence Searching for unknown signal common to set of unrelated sequences Searching for conserved segments in homologous Challenges Combining homologous and non-homologous analysis Merging Annotations mouse pig human Predicting signal-regulatory protein relationships
1 2 3 4 5 6 7 8 9 10 11 12 13 14 1 G A C C A A A T A A G G C A 2 G A C C A A A T A A G G C A 3 T G A C T A T A A A A G G A 4 T G A C T A T A A A A G G A 5 T G C C A A A A G T G G T C 6 C A A C T A T C T T G G G C 7 C A A C T A T C T T G G G C 8 C T C C T T A C A T G G G C Set of signal sequences: Consensus sequence: B R M C W A W H R W G G B M A 0 4 4 0 3 7 4 3 5 4 2 0 0 4 C 3 0 4 8 0 0 0 3 0 0 0 0 0 4 G 2 3 0 0 0 0 0 0 1 0 6 8 5 0 T 3 1 0 0 5 1 4 2 2 4 0 0 1 0 Position Frequency Matrix - PFM Position Weight Matrix - PWM A -1.93 .79 .79 -1.93 .45 1.50 .79 .45 1.07 .79 .0 -1.93 -1.93 .79 C .45 -1.93 .79 1.68 -1.93 -1.93 -1.93 .45 -1.93 -1.93 -1.93 -1.93 .0 .79 G .0 .45 -1.93 -1.93 -1.93 -1.93 -1.93 -1.93 .66 -1.93 1.3 1.68 1.07 -1.93 T .15 .66 -1.93 -1.93 1.07 .66 .79 .0 .79 -1.93 -1.93 -1.93 .66 -1.93 1 2 3 4 5 6 7 8 9 10 11 12 13 14 Score for New Sequence T T G C A T A A G T A G T C .45 -.66 .79 1.66 .45 -.66 .79 .45 -.66 .79 .0 1.68 -.66 .79 Sequence Logo & Information content Weight Matrices & Sequence Logos Wasserman and Sandelin (2004) ‘Applied Bioinformatics for the Identification of Regulatory Elements” Nature Review Genetics 5.4.276
1 (R,l) K 1.0 0.0 Motifs in Biological Sequences 1990 Lawrence & Reilly “An Expectation Maximisation (EM) Algorithm for the identification and Characterization of Common Sites in Unaligned Biopolymer Sequences Proteins 7.41-51. 1992 Cardon and Stormo Expectation Maximisation Algorithm for Identifying Protein-binding sites with variable lengths from Unaligned DNA Fragments L.Mol.Biol. 223.159-170 1993 Lawrence… Liu “Detecting subtle sequence signals: a Gibbs sampling strategy for multiple alignment” Science 262, 208-214. Q=(q1,A,…,qw,T) probability of different bases in the window A=(a1,..,aK) – positions of the windows q0=(qA,..,qT) – background frequencies of nucleotides. Priors A has uniform prior Qj has Dirichlet(N0a) prior – a base frequency in genome. N0 is pseudocounts
Multiple Pattern Occurances in the same sequences: Liu, J. `The collapsed Gibbs sampler with applications to a gene regulation problem," Journal of the American Statistical Association 89 958-966. Prior: any position i has a small probability p to start a binding site: width = w length nL ak Composite Patterns: BioOptimizer: the Bayesian Scoring Function Approach to Motif Discovery Bioinformatics Natural Extensions to Basic Model I Modified from Liu
Correlated in Nucleotide Occurrence in Motif: Modeling within-motif dependence for transcription factor binding site predictions. Bioinformatics, 6, 909-916. Insertion-Deletion BALSA: Bayesian algorithm for local sequence alignment Nucl. Acids Res.,30 1268-77. Start M2 w1 1 w2 w3 M3 K M1 w4 Regulatory Modules: De novo cis-regulatory module elicitation for eukaryotic genomes. Proc Nat’l Acad Sci USA, 102, 7079-84 Stop Gene A Gene B Natural Extensions to Basic Model II
Motifs Coding regions Expresssion and Motif Regression: Integrating Motif Discovery and Expression Analysis Proc.Natl.Acad.Sci. 100.3339-44 1.Rank genes by E=log2(expression fold change) 2.Find “many” (hundreds) candidate motifs 3.For each motif pattern m, compute the vector Sm of matching scores for genes with the pattern 4.Regress E on Sm ChIP-on-chip - 1-2 kb information on protein/DNA interaction: An Algorithm for Finding Protein-DNA Interaction Sites with Applications to Chromatin Immunoprecipitation Microarray ExperimentsNature Biotechnology, 20, 835-39 Protein binding in neighborhood Coding regions Combining Signals and other Data Modified from Liu
Phylogenetic Footprinting (homologous detection) Term originated in 1988 in Tagle et al. Blanchette et al.: For unaligned sequences related by phylogenetic tree, find all segments of length k with a history costing less than d. Motif loss an option. begin signal end Blanchette and Tompa (2003) “FootPrinter: a program designed for phylogenetic footprinting” NAR 31.13.3840-
The Basics of Footprinting • Many aligned sequences related by a known phylogeny: positions HMM: 1 n 1 sequences k slow - rs HMM: fast - rf • Two un-aligned sequences: A C G T ATG A-C A
Statistical Alignment andFootprinting. • Many un-aligned sequences related by a known phylogeny: acgtttgaaccgag---- 1 • Conceptually simple, computationally hard • Dependent on a single alignment/no measure of uncertainty acgtttgaaccgag---- sequences sequences 1 k k acgtttgaaccgag---- 1 sequences Alignment HMM k Alignment HMM Signal HMM Solution: Cartesian Product of HMMs
SAPF - Statistical Alignment and Phylogenetic Footprinting Alignment HMM Signal HMM Sum out Annotate 1 2 Target
BigFoot http://www.stats.ox.ac.uk/research/genome/software • Dynamical programming is too slow for more than 4-6 sequences • MCMC integration is used instead – works until 10-15 sequences • For more sequences other methods are needed.
FSA - Fast Statistical Alignment Pachter, Holmes & Co Data – k genomes/sequences: Iterative addition of homology statements to shrinking alignment: 1 2 http://math.berkeley.edu/~rbradley/papers/manual.pdf k Add most certain homology statement from pairwise alignment compatible with present multiple alignment Spanning tree Additional edges 1 2 3 4 k An edge – a pairwise alignment 1 2 1,3 2,3 3,4 3,k i. Conflicting homology statements cannot be added ii. Some scoring on multiple sequence homology statements is used. 12 2,k 1,4 4,k
Rate of Molecular Evolution versus estimated Selective Deceleration Selected Process Neutral Process A C G T A - q’A,C q’A,G q’A,T C q’C,A - q’C, G q’C,T G q’G,A q’G,C - q’G,T T q’T,A q’T,C q’T,G - A C G T A - qA,C qA,G qA,T C qC,A - qC, G qC,T G qG,A qG,C - qG,T T qT,A qT,C qT,G - How much selection? Selection => deceleration Neutral Equilibrium Observed Equilibrium (pA,pC,pG,pT) (pA,pC,pG,pT)’ Halpern and Bruno (1998) “Evolutionary Distances for Protein-Coding Sequences” MBE 15.7.910- & Moses et al.(2003) “Position specific variation in the rate fo evolution of transcription binding sites” BMC Evolutionary Biology 3.19-
Signal Factor Prediction • Given set of homologous sequences and set of transcription factors (TFs), find signals and which TFs they bind to. • Use PWM and Bruno-Halpern (BH) method to make TF specific evolutionary models • Drawback BH only uses rates and equilibrium distribution • Superior method: Infer TF Specific Position Specific evolutionary model • Drawback: cannot be done without large scale data on TF-signal binding. http://jaspar.cgb.ki.se/http://www.gene-regulation.com/
Knowledge Transfer and Combining Annotations Experimental observations mouse pig • Annotation Transfer • Observed Evolution Must be solvable by Bayesian Priors Each position pi probability of being j’th position in k’th TFBS If no experiment, low probability for being in TFBS human prior 1 experimentally annotated genome (Mouse)
(Homologous + Non-homologous) detection Unrelated genes - similar expression Related genes - similar expression gene promotor Combine above approaches Combine “profiles” Wang and Stormo (2003) “Combining phylogenetic data with co-regulated genes to identify regulatory motifs” Bioinformatics 19.18.2369-80 Zhou and Wong (2007) Coupling Hidden Markov Models for discovery of cis-regulatory signals in multiple species Annals Statistics 1.1.36-65