Download
1 / 19
190 likes | 313 Views
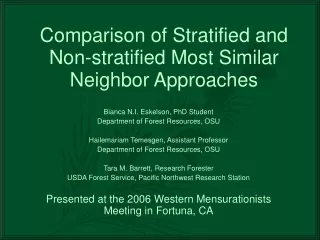
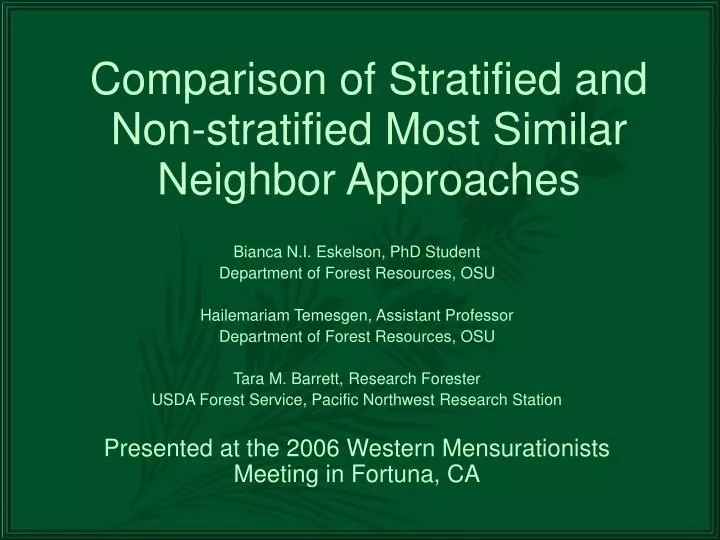
Comparison of Stratified and Non-stratified Most Similar Neighbor Approaches. Bianca N.I. Eskelson, PhD Student Department of Forest Resources, OSU Hailemariam Temesgen, Assistant Professor Department of Forest Resources, OSU Tara M. Barrett, Research Forester

E N D
Comparison of Stratified and Non-stratified Most Similar Neighbor Approaches Bianca N.I. Eskelson, PhD Student Department of Forest Resources, OSU Hailemariam Temesgen, Assistant Professor Department of Forest Resources, OSU Tara M. Barrett, Research Forester USDA Forest Service, Pacific Northwest Research Station Presented at the 2006 Western Mensurationists Meeting in Fortuna, CA
Outline I. Background • Data and inference for natural resource planning • Methods for handling incomplete data II. Simulation study • Objectives • Methods • Results • Summary III. Challenges and opportunities IV. References
I. Background – For natural resource planning • Forested land is divided into polygons (stands, age, species, crown closure, site class, etc.) • Photos/maps/remote sensing complete census for aerial variables (X) • 5 to 10% of land base randomly sampled ground variables (Y)
Inference for natural resource planning is improved by: • “Populating” the forested land database with detailed ground information • Acquiring data on tree and non-tree variables within and across scales • Generating tree-lists (# of stems/ha by species and diameter) for every polygon these lists can provide: • Inputs to habitat and/or growth and yield models • Estimates of current and future stand structure
Methods for handling incomplete data (after Little and Rubin 2002) 1. Complete-case analysis/Available-case analysis • Simple, but loss of information 2. Weighting procedures 3. Imputation-based approaches • Imputation = replacing missing item/unit with another item/unit that has similar characteristics 4. Likelihood or Bayesian approaches
Nearest Neighbor Imputation • Retain covariance structure of data • Retain logical relationships among Y variables • Result in estimates that are within the bounds of biological reality • Not efficient for estimating attributes of ‘rare’ polygons • Not necessarily consistent or unbiased
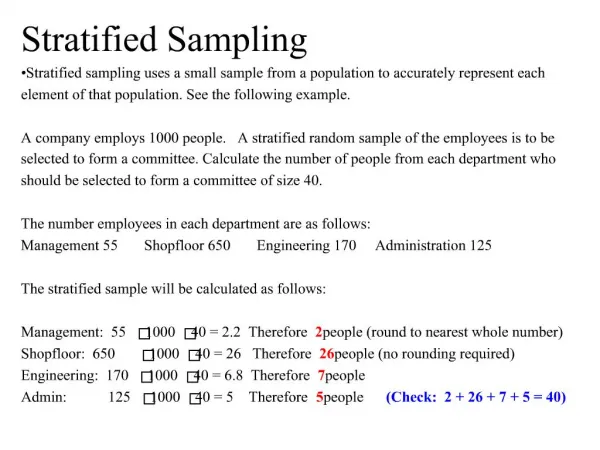
II. Objectives • Improve the estimates of stand tables by species group • Investigate use of stratification into forest type groups and age class prior to using most similar neighbor approach (MSN)
Data • 1092 stands in Western Oregon (FIA data) • Collected in 2001 to 2004
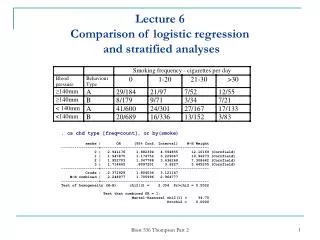
Most Similar Neighbor Method (MSN) • Randomly divide complete data set into reference stands (80%) and target stands (20%) • MSN approach (Moeur and Stage 1995) used to impute Y set for target stands (500 replications) • Distance measure: • Same procedure for each stratum
Assessment over 500 replications • Mean of distance measure
Results – Mean of distance measure • Range of mean distance smaller for all strata than for whole population except for “other conifer” stratum
Results – Mean RMSE Range of mean RMSE larger for all strata compared to whole population
Range of mean bias smaller only for ‘tph hardwoods’ in Douglas-fir stratum compared to whole population Results – Mean Bias
Possible reasons for results • No real aerial data was used • Small data set (40% of inventory in Western Oregon) very small data sets for strata • estimated average age used not a good basis for stratification
Summary • Stratification did not improve estimates • Imputation techniques are data intensive large data sets required • Use of ‘estimated aerial variables’ was a bad choice • Better stratification
III. Challenges and opportunities • Transformations of Y and X variables • Use of LIDAR data instead of aerial photographs to refine imputation approaches • Likelihood or Bayesian approaches • Variance estimation for NN imputed data
IV. References LeMay, V. and H. Temesgen. 2005. Comparison of nearest neighbor methods for estimating basal area and stems per hectare using aerial auxiliary variables. For. Sci. 51: 109-119. Little, R.J.A. and D.B. Rubin. 2002. Statistical analysis with missing data. 2nd ed. John Wiley & Sons. NY. 381 pp. Moeur, M. and A.R. Stage. 1995. Most similar neighbor: an improved sampling inference procedure for natural resource planning. For. Sci. 41: 337-359. Särndal, C.-E. and S. Lundström. 2005. Estimation in Surveys with Nonresponse. John Wiley & Sons. USA. 199 pp. Stage, A.R. 2005. Some New Twists in the Art and Science of Imputation. Presented at the "Evaluation of quantitative techniques for deriving National scale data for assessing and mapping risk workshop”, Denver, CO, July 26-28, 2005.