Download
1 / 25
250 likes | 369 Views
CECD Capability Discussion with BPA. April 9, 2008. CECD Overview. Formed in as Duke Energy Control Area Services LLC (DECA) in 1999 Built to optimize Duke generation asset based on a fleet management philosophy 3 rd party generators and Load Serving Entities began to request CECD services

E N D
CECD Capability Discussion with BPA April 9, 2008
CECD Overview • Formed in as Duke Energy Control Area Services LLC (DECA) in 1999 • Built to optimize Duke generation asset based on a fleet management philosophy • 3rd party generators and Load Serving Entities began to request CECD services • In February 2005 became Constellation Energy Control and Dispatch (CECD) after an unsolicited offer was made to purchase the DECA LLC Operations. • Successfully certified and currently manage all-requirements for 5 separate cities and over 11,400 MW of generation in 5 regions including WECC • Highly experienced Staff focused on EMS and NERC/Regional policies • Successfully completed 10 NERC Compliance reviews in October of 2007 • Successfully completed 10 Readiness Audits in October of 2007 • 7 to 9 man Certification Team onsite review of facilities and Staff • Utilize multiple dynamic and/or pseudo ties to and from load and generation
CECD Services • National control center operates throughout North America • Secure client web access to performance data activity 24/7 in real time, historically and forward schedule requirements • Provide continuous asset management and oversight, power tagging, ancillary services management, data access and dynamic scheduling • Enable clients to manage power supplies and sales to maximize profitability while reducing physical and financial risk • Employs multiple high-speed data connection to regional authorities, reliability authorities, RTOs to maintain data integrity • Energy Integration, regulation, balancing, and demand response • Implement and coordinate operation of A.G.C., pseudo ties, dynamic schedules • Compliance management and reporting (GADS, FERC 714 and EIA 411) • Energy shadow settlements, reporting and dispute resolution • Emergency and planned outage response and coordination • Reserve pool management and energy-replacement services
Optimization and Management Tools – Software Systems • Integrated EMS, Planning, Accounting and Reporting System • Generation Management System Customized for Wind • Full Disaster Recovery Operations Infrastructure • Web-based Performance Reports • Simplifies communication of Real-time EMS and Other Pertinent Data • Determine and Monitor Asset Value • Assess and Optimize Unit Performance • Energy- Settlements Tracking and Reconciliation (E-Star)
Current CECD Customer Base All Requirements Load Served Generating Facilities Served
The MW Dashboard assesses plant performance in terms of MW produced and settled against plan.
Data Drill Down • Display node Detail, Average, Statistics, Frequency, Correlation • Chart display and tabular data result formats • Data filtered according to search criteria • Customize graphs and results on-the-fly Tab through data for additional information Export current view to Excel • Re-chart: • Add moving averages • Add Footprint level • See impact of Load/Control Tabular display of detail data presented in chart
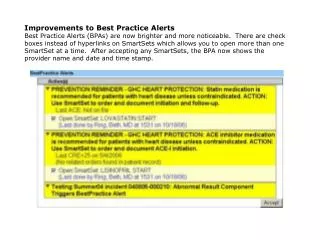
Real-Time monitoring reports real-time EMS and other pertinent data through a series of web-based user reports
Search Features • Standard across reports • Flexible multi-selection • Save frequent searches to build a portfolio • Filter results over/under input thresholds. • Rank results by: • Delta • Stand Dev • Day-ahead • Real Time • Loss • Congestion Filter set by days, hours or product Quickly find any ISO node Memorize selections as “Preferences”. Set as default or recall saved reports with one-click
Chart Analysis • Choose any point, any ISO and chart results • Compare nodes results against each other • Add in ISO footprint and zone data • Hover over points for detail information
Dispatch Log Auditable Dispatch Log event data supports back office tie out activities.
M M Energy Flow – Gen. Control Area Supplying AGC MW to 3rd party (Transmission Provider indicated as Intermediary Control Area) AGC Set Point (Block Schedule + Reg. MW request + X% Loss factor) IPP Generator Interconnection Meter CECD Dynamic or Pseudo Tie (AGC MW) Incumbent Control Area Tie Meter Dynamic Signal ( Reg. Request MW + X% Loss factor) Receiving Control Area or Load Center Dynamic or Pseudo Tie (Reg. Request MW * factor for losses) Legend: Heavy arrow denotes actual energy flow Light arrow denotes pseudo ties for ACE calculation Dotted arrow denotes 4 second data flow
AGC Incremental/decremental Signal from BPA to IPP (Data Flow Example) BPA System Load M BPA Metering RTU BPA Pseudo Tie or Dynamic Tie Value to BPA Transmission Control IPP Generating Station BPA EMS AGC MW desired from IPP IPP Pseudo Tie Value to BPA Transmission IPP Tie Meters CECD ICCP Gateway ICCP Gateway Data Circuit M Actual MW AGC MW Signal CECD EMS Gen(s) BPA OATI E-tag Schedules Aux AGC (Total MW) NOTE: The RTU Link To BPA is One method of passing data We may use only the ICCP Link IPP Block Schedules Data Circuit CECD Site SMP IPP DCS RTU IPP Dynamic or Pseudo Tie Value to BPA Transmission Total MW ( Block + BPA Inc/dec MW Request) Switchyard RTU
ICCP / RTU Data Flow IPP / CECD BPA Transmission Control Area BPA Load/ System Management Legend: • Daily Contract MW (between BPA and IPP) • BPA Regulation Request. BPA Pseudo Tie • Hourly Integrated Pseudo Tie & Rounded MWH • Hourly Integrated Pseudo Tie & Rounded MWH delivered from IPP • Echo BPA Regulation Request • IPP Regulation Flag, IPP Pseudo Tie • Regulation Invalid Flag, Adjusted BPA Regulation Request RTU also
Loss Factor Without Losses With Losses
JT Thompson Office: 713-332-2901 Cell: 281-221-5475 Email: JT.THOMPSON@Constellation.com Address: 500 Dallas Street One Allen Center, Suite 3015 Houston, Texas 77002