Download
1 / 10
100 likes | 107 Views
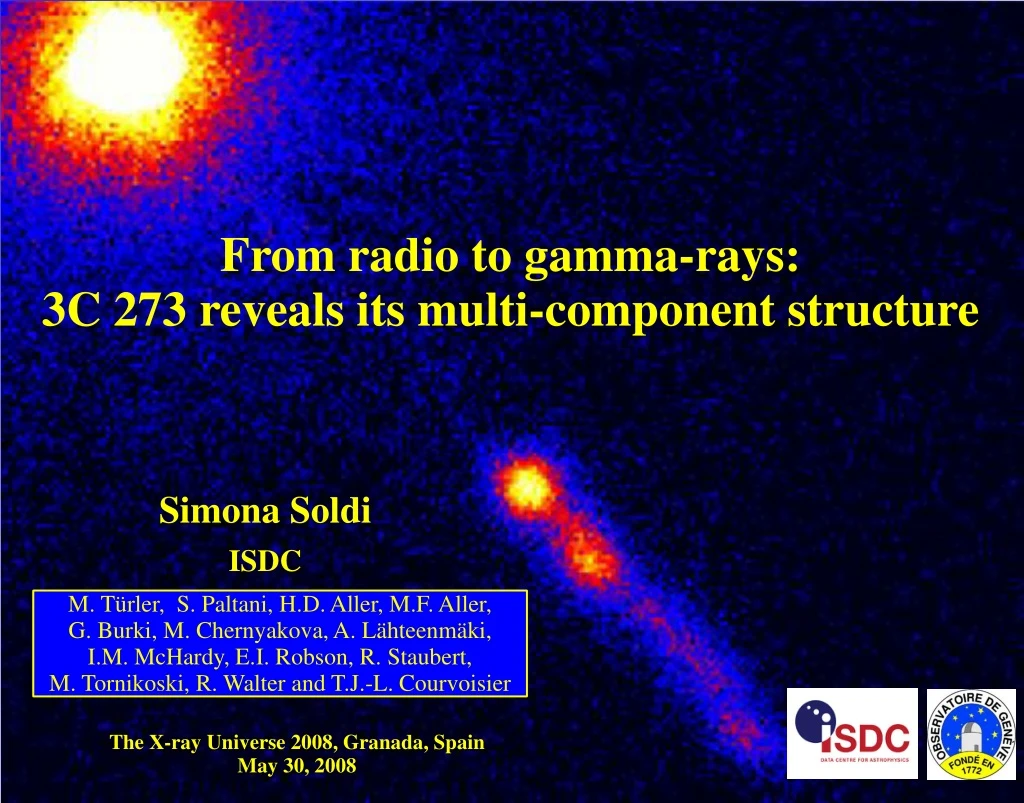
M. T ü rler, S. Paltani, H.D. Aller, M.F. Aller, G. Burki, M. Chernyakova, A. L ä hteenm ä ki, I.M. McHardy, E.I. Robson, R. Staubert, M. Tornikoski, R. Walter and T.J.-L. Courvoisier. From radio to gamma-rays: 3C 273 reveals its multi-component structure. Simona Soldi ISDC.

E N D
M. Türler, S. Paltani, H.D. Aller, M.F. Aller, G. Burki, M. Chernyakova, A. Lähteenmäki, I.M. McHardy, E.I. Robson, R. Staubert, M. Tornikoski, R. Walter and T.J.-L. Courvoisier From radio to gamma-rays: 3C 273 reveals its multi-component structure Simona Soldi ISDC The X-ray Universe 2008, Granada, Spain May 30, 2008
Simona Soldi The quasar 3C 273 • The brightest quasar in the sky (V = 12.9) • z = 0.158 • Emission from radio to -ray energies, with large flux variations • Jet with apparent superluminal motion • Both blazar and Seyfert-like properties 20-70 keV 5 keV V K 3.3 mm 15 GHz g-rays radio-mm X-rays IR V UV 2/10 The X-ray Universe 2008 – May 30, 2008
Simona Soldi The 3C 273 multi-wavelength database http://isdc.unige.ch/3c273/ . Türler et al. 1999 Soldi et al. 2008, astro-ph/0805.3411 • 40 yearsof observations • > 22,000 observations • 70 light curves fromradio to g-rays • 15 years of intense X-ray monitoring 3/10 The X-ray Universe 2008 – May 30, 2008
Simona Soldi Thermal emission from dust (Soldi et al. 2008) IR V IR lag V lag UV Correlation between optical-UV and IR Different IR lags, increasing with IR wavelength Clear signature from dust thermal emission IR lag UV lag 4/10 The X-ray Universe 2008 – May 30, 2008
Simona Soldi Infrared emission at the jet minimum (Türler et al. 2006) • Historic jet-emission minimum in June 2004 • Multi-l campaign • IR excess • no variations in the near-IR • several dust components 5/10 The X-ray Universe 2008 – May 30, 2008
Simona Soldi Long-term X-ray variations Chernyakova et al. 2007 6/10 The X-ray Universe 2008 – May 30, 2008
Simona Soldi Hard X-ray - mm relation X-ray lag 1.3 mm lag ⇒ the dominant process in the hard X-rays is not related to the radio-mm flaring emission 7/10 The X-ray Universe 2008 – May 30, 2008
Simona Soldi The origin of the hard X-ray emission X-ray lag V lag ⇒hard X-rays from inverse Compton of optical/synchrotron electrons? 8/10 The X-ray Universe 2008 – May 30, 2008
Simona Soldi Variability properties of the X-ray emission BATSE ⇒ different variability properties of medium and hard X-rays One or two components contributing? From structure function analysis 9/10 The X-ray Universe 2008 – May 30, 2008
Simona Soldi Discussion and conclusions Hard X-ray electrons not related to the jet flaring emission Synchrotron emission in the optical band Dust emission is dominant in the near-IR, but also synchrotron components are contributing In spite of the large amount of data, still unclear what is at the origin of the X-ray emission Multi-wavelength databases are a precious tool! For more details, see Soldi et al. 2008, A&A in press, astro-ph/0805.3411 10/10 The X-ray Universe 2008 – May 30, 2008