Download
1 / 33
330 likes | 483 Views
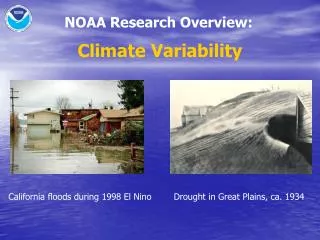
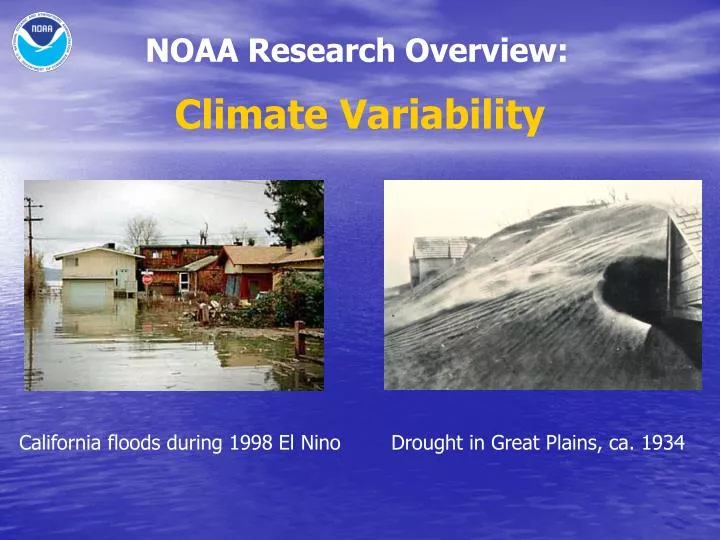
NOAA Climate Research: Climate Variability. NOAA Research Overview:. Climate Variability. California floods during 1998 El Nino. Drought in Great Plains, ca. 1934. Mission-critical research. Climate variability research is critical to NOAA’s mission:

E N D
NOAA Climate Research: Climate Variability NOAA Research Overview: Climate Variability California floods during 1998 El Nino Drought in Great Plains, ca. 1934
Mission-critical research Climate variability researchis critical to NOAA’s mission: “To understand and predict changes in the Earth’s environment and conserve and manage coastal and marine resources …” And, specifically, Strategic Goal 2: “Understandclimate variabilityand changeto enhance society’s ability to respond”.
NOAA Strategic Plan Performance Measures CV: Overall Strategy Four components: • Monitor and Observe • Understand and Describe • Assess and Predict • Engage, Advise, and Inform For the success of the overall program, it is vital that these components be linked together.
Measures of success Measures of Success Understand and describe: • Increased number of new research findings and progress toward their implementation into NOAA operations. • Decreased degree of uncertainty of climate system processes.
CCSP priority U.S. Climate Change Science Plan Chapter 4: Climate Variability and Change Major Research Questions: To what extent can uncertainties due to climate feedbacks be reduced? 2. What are limits of climate predictability, and how can climate predictions and climate change projections be further improved? What is the likelihood of abrupt climate changes? 4. How do extreme events respond to climate variability and change? 5. How can information on climate variability and change be most efficiently developed and communicated to serve societal needs?
CV Research Priorities Research Priorities NOAA CV programs emphasize priority areas described in the CCSP and NOAA SP. • Increase understanding of climate feedbacks (CLIVAR; NOAA labs; SEARCH). 2. Clarify limits to climate predictability; improve climate predictions (CLIVAR; CDC; other NOAA labs). • Increase understanding mechanisms for abrupt climate change (CLIVAR ATL, SEARCH). 4. Response of extreme events to climate variability and change (Weather-Climate Connection; CDC, ETL, AOML). 5. Develop climate information to serve societal needs (CDC; overall program, especially where linked to RISAs, CDEP, NWS, and IRI).
CV Resource allocation CV Resource Allocation (FY03 est.) (in $M) CLIVAR 20.6* SEARCH 2.0 WX-CLIM .9 AOML 4.2 CDC 2.5 ETL .2 FSL .2 PMEL 2.4 ENSO obs (PMEL) 4.7 35.3 * CLIVAR amount includes $6.1 M for sustained ocean obs., and OGP-sponsored research funding for CLIVAR Pacific, CLIVAR Atlantic, and CLIVAR Pan-American Climate Studies (PACS).
Support for Observing Systems NOAA’s global and regional observing systems are crucial in supporting monitoring, interpretations, and predictions of climate variability. Total Climate Variability contributions to the Climate Observation Program are $13.1M (CLIVAR Obs $5.1M, OAR Labs $8M).
Core Activities NOAA Base Components: Climate Variability Research • Office of Global Programs • Climate Variability and Predictability (CLIVAR) - CLIVAR Atlantic - CLIVAR Pacific - CLIVAR Pan-American Climate Studies (PACS) • Climate Observations and Services Program (COSP) • Study of Environmental Arctic Change (SEARCH) • Weather-Climate Connection • NOAA Research labs
NOAA OGP CLIVAR Program NOAA/OGP CLIVAR Program • CLIVAR Atlantic • CLIVAR Pacific • CLIVAR Pan-American Climate Studies (PACS)
CLIVAR Climate Variability and Predictability Overall Objectives: • Develop an understanding of of natural climate variations and their global and regional manifestations. • Assess predictability of these climate modes through observational and modeling studies. Foci: • El Niño - Southern Oscillation (ENSO), Pacific Decadal Variability (PDV), Arctic Oscillation (AO), North Atlantic Oscillation (NAO), Tropical Atlantic Variability, and North American monsoon system. • Abrupt climate change (Atlantic thermohaline circulation). Method: • Sponsor PI research/field experiments in key regions: CLIVAR-Pacific, CLIVAR-Atlantic, CLIVAR-PACS. • Support interagency national and international programs. • Implement Climate Model Process Teams (CPTs) to develop and improve climate model representations of physical processes.
CLIVAR Atlantic aims to describe changes in, and assess predictability of, three major climate phenomena • Tropical Atlantic Variability(TAV) • North Atlantic Oscillation(NAO) • Meridional Overturning Circulation(MOC) Figure courtesy of Science (2002)
CLIVAR Atlantic research examples • Coupled modeling - TAV, NAO • P. Chang and R. Saravanan • S.-P. Xie • J. Marshall • Coupled modeling - tropical teleconnections • M. Hoerling and J. Hurrell • Ocean modeling - TAV (including subtropical cells), MOC • G. Halliwell and R. Weisberg • Atmospheric analysis- NAO • J. Hurrell et al. • R. Miller et al. • M. Baldwin and T. Dunkerton • Data set development and analysis - TAV, MOC, NAO • P. Niiler • L. Yu and R. Weller
CLIVAR Pacific Objectives • Improve understanding of Pacific basin-scale atmosphere-ocean variability, its predictability on seasonal and longer timescales, and anthropogenic impacts. Particular foci include ENSO and Pacific Decadal Variability. This requires further comprehensive analysis, testing and improvement of coupled models. • Document time-varying T, S, currents in the upper ocean at 300 km, 10 day resolution over the entire basin north of 40o S for a 15 year period, with higher resolution in boundary currents and near the equator. Apply ODA to provide a three-dimensional time-dependent analysis based on this data. • Document time-varying vertical and lateral fluxes and air-sea exchange of heat, fresh water, and momentum over the corresponding period. • Improve physical parameterizations in OGCMs, AGCMs and NWP models via process studies and via ODA, which as a by-product identifies systematic errors in the atmospheric forcing of the ocean or the assimilating ocean model.
PACS Science Objectives PACS seeks to extend the scope and improve the skill of climate prediction over the Americas on subseasonal to interdecadal time scales with an emphasis on summer precipitation. Specific objectives: • Improve understanding and provide more realistic simulations of coupled ocean-atmosphere-land processes, with emphasis on: • the response of planetary-scale atmospheric circulation and precipitation patterns to potentially predictable surface boundary conditions • the mechanisms that couple climate variability over ocean and land • the seasonally varying climatological mean state of the ocean, atmosphere, and land surface • The effects of land surface processes and orography on the variability of seasonal rainfall • Determine the predictability of warm-season precipitation anomalies over the Americas on seasonal and longer time scales. • Advance the development of the climate observing and prediction system for seasonal and longer time scales.
PACS Foci PACS focuses on the phenomena that are crucial for organizing seasonal rainfall patterns: - the oceanic ITCZs - the continental scale monsoon systems, - the tropical and extratropical storm tracks For implementation, three regional process study domains are defined: - Eastern Pacific (EPIC and VEPIC) - North American Monsoon System (NAME) - South American Monsoon System (MESA) NAME EPIC MESA
PACS Achievements • Established enhanced pibal upper air sounding network and auxiliary raingauge networks to augment existing networks over Pan-America for studying low-level flow and precipitation • Enhanced observing system in eastern Pacific with extension of 95W TAO line and stratus mooring • Initiated the PIRATA array of moored buoys in the tropical Atlantic
PACS Deliverables • Measured improvements in coupled climate models capability to predict North and South American climate variability months to seasons in advance • Infrastructure to monitor and predict the North and South American monsoon systems • More comprehensive understanding of Pan-American summer climate variability and predictability • Contributions to assessments of climate variability and long-term climate change for regions within North and South America • Strengthened multinational scientific collaboration across Pan-America
CLIVAR: deliverables CLIVAR milestones/deliverables • Improved climate predictions for global climate variability on S/I and longer time scales. • Contributions to the development of the sustained global climate observing system, esp. ocean observations. • Data sets from process field campaigns. • Improved physical understanding of climate feedbacks. • Assessments of predictability of climate modes. • Accelerated improvements in modeling of physical processes through the CPTs. Initiate a CPT focusing on deep atmospheric convection (Q4, OGP). • Conduct the South American Low Level Jet Experiment (Q2, OGP) • Enhance observations in Mexico and the southwest U.S. for NAME experiment (Q4, OGP)
SEARCH Study of Environmental Arctic Change (SEARCH) Objectives: • Identify causes for observed multi-decadal trends of interrelated changes in the Arctic (atmosphere, ice, ocean, land). • Clarify potential for feedbacks (albedo, fresh water export, • release of carbon from permafrost/methane hydrates) • Determine implications for abrupt changes. • Assess impacts to ecosystem and society. Foci: • Interannual to decadal time scales. • Arctic/subarctic ocean fluxes; relationship to thermohaline variability. • Expand on limited observations to track key variables; • incorporate into models. Method: • Implement and sustain environmental observations. • Data analysis and process research. • Coordinated with other agencies in SEARCH, as well as larger national and international programs in Arctic research.
SEARCH Products Examples: SEARCH Products Atmosphere-Ocean-Land Surface Interactions and Feedbacks over Arctic Prototype Observing Array
SEARCH Products/deliverables SEARCH deliverables • Temperature, radiation and ice data to support analyses of ice/albedo feedback, ocean thermohaline circulation, Arctic shipping routes, marine mammal management. • Atmospheric data to enhance model physics and improve prediction of Arctic Oscillation, US temperature and hydrologic forecasts • Long-term data to detect decadal changes, demonstrate links to mid-latitudes
Weather-Climate Connection Weather-Climate Connection Objectives: • Improve understanding and predictions of links between climate variations and high impact weather phenomena • Improve regional observing capabilities • Develop stronger link between climate research and user needs • Infuse new science and technology into NOAA operations Foci: • Improve predictions on weekly to seasonal time scales. • Initial focus on tropical-midlatitude interactions over the Pacific and their regional impacts on U.S. Method: • Observational, diagnostic, and modeling studies at regional scales to assess predictability and realize the potential for operational prediction. • Research coordinated with services (NWS) and end users.
Research example: Wx-Clim. Connection Weather-climate Connection 40” of rain/ 7 days Pineapple Express MJO • Where will storm track be for the next few weeks? • When will an arctic outbreak affect the east coast? • When will the rain (drought, heat wave, etc.) end? • How will a climate shift affect the weather in a particular region?
Week 2 reliability and skill score derived from an Ensemble MRF Reforecast Experiment (CDC) (23 years of training data, cross validated) Bottom line: Big gains can be made in forecast skill by statistically correcting forecasts from a “frozen” model. Validations over last two years indicate that skills of U.S. T, p week two (8-14 day) forecasts derived by this method are superior to official 6-10 day forecasts.
How many years of training data are needed? Results suggest that most of the gains can be achieved by conducting reforecasts for 5-10 years, with forecasts run every 4-5 days.
Weather-Climate Connection: deliverables Weather-Climate Connection: Milestones/Deliverables • Improved regional forecast capabilities of U.S. temperatures and precipitation from a week to a season. • Climate prediction capabilities for high-impact events, including droughts and major floods. • Enhanced data sets and analyses to identify and interpret weather-climate connections between the tropics and mid-latitudes. • Develop modified and improved practices for biweekly and/or monthly U.S. temperature and precipitation outlooks (Q2; CPC/CDC).
Research Laboratories NOAA Research Objectives: • Carry out long-term research central to NOAA’s mission • Provide sustained support for NOAA climate observations and services (e.g., NWS Climate Prediction Center) • Deliver products for decision support • Regular and timely provision of climate obs. and predictions Foci: • Develop national capabilities to describe, interpret, and predict climate variations, emphasizing major climate phenomena such as ENSO, droughts, and floods. • Provide and interpret ocean data • Develop capabilities to monitor and predict the ocean environment on time scales from days to decades.
PMEL: Recent Accomplishments • Monitor and observe: The TAO array has provided accurate, high resolution, real-time data for tracking the evolution of the 2002-2003 El Niño. • Understand and describe: TAO data and related shipboard measurements have supported approximately 50 refereed journal publications per year on climate variability and change. • Assess and predict: The TAO array is the backbone of the ENSO observing system providing real-time data essential for accurate analyses and forecasts of evolving climatic conditions in the tropical Pacific. TAO data were fundamental to the successful NCEP forecast in January 2002 that an El Niño was developing. • Engage, advise, inform: a) PMEL scientists serve on many national and international committees promoting awareness of climate science and NOAA’s climate mission. c) TAO web pages, providing valuable information to the general public, educators, government policy makers and private businesses, received nearly 25 million hits in the past year.
Test of Bridge Hypothesis in GFDL Model (CDC, GFDL) - obs. vs. model correlations - 1950-99 Observed SSTs (FMA) correlated with Niño Index (NDJ) Mixed Layer Model correlations - SSTs (FMA) specified in Niño region, MLM elsewhere
The Perfect Ocean for Drought (CDC, CPC) Observed Temperature and Precipitation anomalies (June 1998 - May 2002) Model-simulated Temperature and Precipitation Anomalies given SSTs over this period
Research lab deliverables NOAA Research: FY03 Milestones/Deliverables • Determine the origins and assess the predictability of the 1998-2002 U. S. drought, leading to improved drought forecasts (Q2, CDC) • Continue internationally coordinated studies to determine the role of the Tropical Atlantic on global climate (Q3, AOML) • Develop a website dedicated to ongoing, real-time predictions of tropical convection associated with the MJO (Q3, CDC). • Provide data for operational forecasting and analyses of the 2002-2003 El Niño and for comparisons with previous events (Q4, PMEL).