Download
1 / 37
370 likes | 545 Views
CSTS Data Entry. The Cardiovascular Surgery Translation Study (CSTS) JHU Armstrong Institute for Patient Safety & Quality. Objectives. To understand the importance of accurate data collection and entry. To understand the data collection and entry requirements for the CSTS.

E N D
CSTS Data Entry The Cardiovascular Surgery Translation Study (CSTS) JHU Armstrong Institute for Patient Safety & Quality
Objectives • To understand the importance of accurate data collection and entry. • To understand the data collection and entry requirements for the CSTS. • To outline next steps towards implementing data collection activities as part of CSTS.
Importance of “Good” Data • We must ensure that the data we collect are accurate, complete and in the required format. • The data we collect and enter are the ultimate proof of our success & de-identified, aggregated data will be shared broadly (i.e., they will influence care and policy).
Roles of Data Baseline – Tells us where we are at the start. On-going – Tells us whether and how we are changing our outcomes and performance. Overall – Tells us what impact we (i.e., the project and its initiatives) have on the goal of reducing/eliminating Healthcare Associated Infections (CLABSI, SSI, VAP).
CSTS Timeline • Planned Roll-out • CLABSI Prevention interventions and monthly data collection: June 2011 • SSI Prevention interventions and monthly data collection: approximately September 2011 • VAP Prevention interventions and monthly data collection: after December 2011
CLABSI Data Data for this project are collected according to National Healthcare Safety Net (NHSN) definitions for catheter-line associated blood stream infections (CLABSI). http://www.cdc.gov/nhsn/
CLABSI Data • Baseline: entered once at start of project. Usually for the year preceding the start of the immersion calls. For this project, baseline is entered for the entire year (instead of monthly). • Monthly: entered by the 15th of the month. • For example, June’s data is entered by July 5th. • Total number of CLABSIs in the unit for the period of interest (baseline or month). Numerator • Total number of central line days in the unit for the period of interest(baseline or month). Denominator
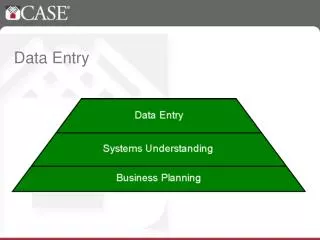
Data Entry Web-based data entry tool. Tool provides for data entry and reporting Baseline data entered prior to work with CSTS checklist and methods. Monthly data entered by the 15th of each month. Users can edit monthly data. Rolling 6-month lock on the data. Data quality checks built into the system. Web-based system will send reminders of data due & overdue
Data Entry CLABSI Select the form for which you want to enter data.
Data Entry CLABSI Select the month for which you want to enter data.
Data Entry CLABSI Either enter numerator & denominator OR check “data not collected for this period.”
Data must be entered sequentially. Cannot enter data for July until June’s data entry is complete.
No fields may be left blank. Data will not be saved if a field is left blank.
Cannot have the same denominator (total number of central line days) in two consecutive reporting periods
Cannot have > 2 SD difference in numerator (number of catheter line associated blood stream infections).
The numerator cannot be greater than the denominator (can’t have more infections than line days).
Resolving Data Problems • If the data entry system alerts you to a problem with the data. Please check to make sure that the data you’ve entered are correct. • > 2 SD difference in numerator • Same denominator in 2 sequential reporting periods • Numerator greater than denominator • You can still enter the data but need to check with your infection preventionist/hospital epidemiology to ensure the data are correct. • If you need to make a correction you can edit the data.
Data Entry CLABSI Remember to click on Save to write & save data to the database.
Summary Teams will collect & enter data monthly. CLABSI data will be collected first with SSI & VAP rolled out in the future. All teams complete a Monthly Team Checkup Tool. Ensuring data quality is of utmost importance. Complete training on the web-based data base. Watch for information & training on HSOPS, SSI, VAP
Action Items Identify HOW and from WHOM monthly CLABSI data (numerator & denominator) will be obtained. Determine the process for completing the Team Checkup Tool monthly for your clinical area. Identify WHO will be responsible for data entry in your clinical area. Ensure that everyone involved in data entry is trained & understands what they need to do. Develop a process for ensuring data quality control.
Team Checkup Tool Mike Rosen will now talk with you about the Monthly Team Checkup Tool.
Team Checkup Tool The Cardiovascular Surgery Translation Study (CSTS) JHU Armstrong Institute for Patient Safety & Quality
What is the TCT? • Measures CUSP team activities and interactions, leadership support, intervention spread on the unit • Monthly form (for first 6 months; then drops to quarterly) • Turned in by the 15th of each month for the last month (e.g., Feb TCT due Mar 15) • Used in the KICU CLABSI collaborative, the RWJF-CLABSI collaborative, National Stop BSI and the Keystone Surgery collaborative
Why the TCT? • Importance of measuring process • How will you know what is not working? • How will we know the intervention was in fact used by teams? • The measurement of team implementation activities, functioning, and leadership support is often missing or incomplete in QI/PS initiatives and thus the full extent of the QI/PS team influence on outcomes is unknown
Ways you can use the TCT • Use the form as a project management tool (e.g., a checklist) • Check in with your team about what they think • Report your activity upward to management (highlight needs) • Monitor your progress in CUSP steps and CLABSI/ SSI/ VAP reduction steps • Identify barriers in teamwork and communication to guide corrective action • Identify activities of other teams; compare pace of your project
Other ways the TCT can help you • Faculty can use to respond to educational needs of teams • Society and science can learn from the elements of team context that influence performance
What we have learned from TCTs in other projects • The Team Check-Up Tool demonstrates good measurement reliability, validity and responsiveness (RWJF-Adventist data)(Chan et al. 2010, submitted) • Participation in CUSP (measured on the TCT) is associated with significant improvement in Safety Attitudes Questionnaire scores over 2 years –that means CUSP participation improves Safety Culture!(Michigan Keystone data) (Hsu dissertation 2011)
Useful knowledge from the TCT • Five months of Keystone data (~107 ICUs), Mar-Jul 05 • More frequent senior executive meeting was associated with lower CLABSI rates (IRR=0.76, p<0.001). • Not enough leadership support from executiveswas associated higher CLABSI rates (IRR=2.84, p=0.001) • Inability to work togetherwas associated with higher CLABSI rates (IRR=3.11, p=0.037)
Useful knowledge from the TCT • Adventist data (45 ICUs), Mar 07 - Feb 08 • Educational activity “infection control visit/talk” was associated with higher CLASBI rates (IRR=2.44, p=0.012) • Appropriate hand hygienewas associated with lower CLABSI rates (IRR=0.41, p=0.019)
Useful knowledge from the TCT • Adventist data (45 ICUs), Mar 07 - Sep 08 • ICU teams reporting work distractions were less likely to perform full-barrier precautions (coef.=-0.13, p=0.034) and remove unnecessary lines (coef.=-0.14, p=0.009)
Conclusion • Measuring process is critical to your progress • High quality data and regular submission of data is essential to the project’s success and • Project success will establish the public legacy of your efforts