Download
1 / 15
150 likes | 307 Views
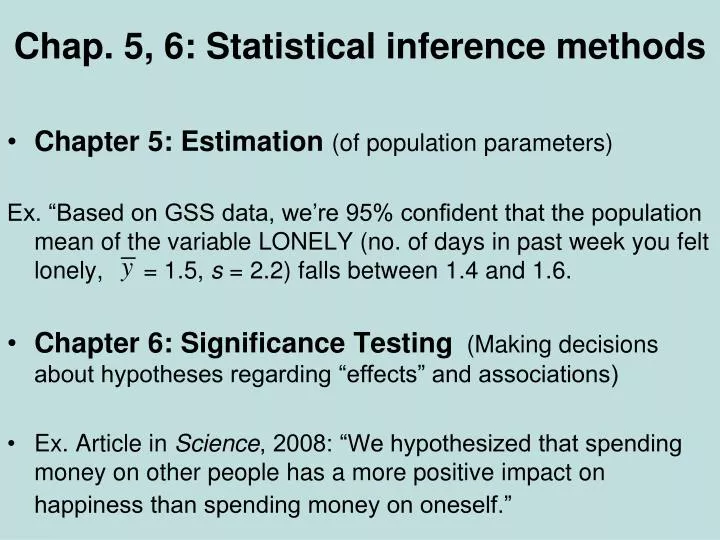
Chap. 5, 6: Statistical inference methods. Chapter 5: Estimation (of population parameters) Ex. “Based on GSS data, we’re 95% confident that the population mean of the variable LONELY (no. of days in past week you felt lonely, = 1.5, s = 2.2) falls between 1.4 and 1.6.

E N D
Chap. 5, 6: Statistical inference methods • Chapter 5: Estimation (of population parameters) Ex. “Based on GSS data, we’re 95% confident that the population mean of the variable LONELY (no. of days in past week you felt lonely, = 1.5, s = 2.2) falls between 1.4 and 1.6. • Chapter 6: Significance Testing (Making decisions about hypotheses regarding “effects” and associations) • Ex. Article in Science, 2008: “We hypothesized that spending money on other people has a more positive impact on happiness than spending money on oneself.”
Confidence Interval for the Mean • In large random samples, the sample mean has approximately a normal sampling distribution with mean m and standard error • Thus, • We can be 95% confident that the sample mean lies within 1.96 standard errors of the (unknown) population mean
Problem: Standard error is unknown (s is also a parameter). It is estimated by replacing s with its point estimate from the sample data: • 95% confidence interval for m : • This works ok for “large n,” because s then is a good estimate of σ (and CLT applies).
Example: TV watching in U.S.(problem 5.25) • GSS asks “On an average day, how many hours do you personally watch TV?” • For n = 899, = 2.865, s = 2.617 • What is a 95% CI forthe population mean? • Interpretation? • Problem: 5.21, 5.23
Multiple choice: • We can be 95% confident the sample mean is between 2.69 and 3.04. • 95% of the population watches between 2.69 and 3.04 hours of TV per day • We can be 95% confident the population mean is between 2.69 and 3.04 • If random samples of size 899 were repeatedly selected, in the long run 95% of them would contain = 2.865
The 95% confidence interval for m : • works for “large n,” because 1) the CLT applies and 2) s then is a good estimate of σ. • But for small n, replacing σ by its estimate s introduces extra error, and the CI is not quite wide enough unless we replace z-score by a slightly larger “t-score.” • The statistician William Gosset of Guinness Breweries, Dublin (1908), developed t methods to solve the problem.
Because of company policy forbidding the publication of company work in one’s own name, Gosset used the pseudonym Student in articles he wrote about his discoveries (sometimes called “Student’s t distribution”) • He was given only small samples of brew to test (why?), and realized he could not use normal z-scores after substituting s in standard error formula.
The t distribution (Student’st) • Bell-shaped, symmetric about 0 • Standard deviation a bit larger than 1 (slightly thicker tails than standard normal distribution, which has mean = 0, standard deviation = 1) • Precise shape depends on degrees of freedom (df). For inference about mean, df = n – 1 • Gets narrower and more closely resembles standard normal distribution as df increases (t and z values are nearly identical when df > 30) • CI for mean has margin of error t(se), (instead of z(se) as in CI for proportion)
Part of a t table Confidence Level 90% 95% 98% 99% df t.050 t.025 t.010 t.005 1 6.314 12.706 31.821 63.657 • 1.812 2.228 2.764 3.169 16 1.746 2.120 2.583 2.921 30 1.697 2.042 2.457 2.750 100 1.660 1.984 2.364 2.626 infinity 1.645 1.960 2.326 2.576 df = corresponds to standard normal distribution
CI for a population mean • For a random sample from a normal population distribution, a 95% CI for µ is where df = n - 1 for the t-score • Normal population assumption ensures sampling distribution has bell shape for any n.
Example: Anorexia study(p.120 and problem 5.24) • Weight measured before and after period of treatment • yi= weight at end – weight at beginning • For n=17 girls receiving therapy for anorexia: • yi= 11.4, 11.0, 5.5, 9.4, 13.6, -2.9, -0.1, 7.4, 21.5,-5.3, -3.8, 13.4, 13.1, 9.0,3.9, 5.7, 10.7 • In a minute, problem: 5.19 and 5.26 by the use of Excels AnalysisToolPak.
SPSS: Analyze -> compare means ->1-sample t test --------------------------------------------------------------------------------------- Variable n Mean Std.Dev. Std. Error Mean weight_change 17 7.265 7.157 1.736 ---------------------------------------------------------------------------------------- se obtained as Since n = 17, df = 16, t-score for 95% confidence is 2.12 95% CI for population mean weight change is • We can predict that the population mean weight change µ is positive (i.e., the treatment is effective, on average), with value of µ between about 3.6 and 10.9 pounds. • Note: The t method for CIs assumes a normal population distribution. Do you think that holds here?
Choosing the Sample Size • Determine parameter of interest (population mean or population proportion) • Select a margin of error (M) and a confidence level (determines z-score) Proportion (to be “safe,” set p = 0.50): Mean (need a guess for value of s):
Example: n for estimating mean • Future anorexia study: We want n to estimate population mean weight change to within 2 pounds, with probability 0.95. • Based on past study, guess σ = 7 • Problem: 5.40 • Note: Don’t worry about memorizing formulas such as for sample size.
Some comments about sample size • We’ve seen that n depends on • confidence level (higher confidence requires larger n)and • the population variability (more variability requires larger n) • In practice, determining n not so easy, because (1) many parameters to estimate, (2) resources may be limited and we may need to compromise