Download
1 / 17
170 likes | 342 Views
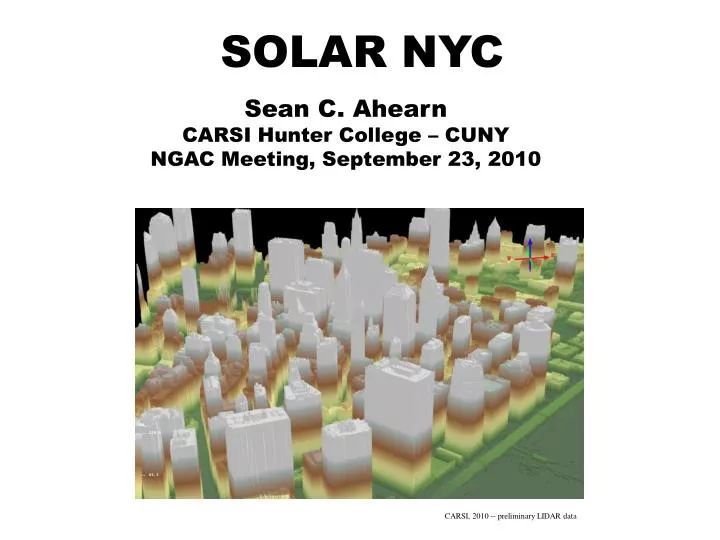
SOLAR NYC. Sean C. Ahearn CARSI Hunter College – CUNY NGAC Meeting, September 23, 2010. CARSI, 2010 -- preliminary LIDAR data. Collaborations. SOLAR NYC: The Players.

E N D
SOLAR NYC Sean C. Ahearn CARSI Hunter College – CUNY NGAC Meeting, September 23, 2010 CARSI, 2010 -- preliminary LIDAR data
Collaborations SOLAR NYC: The Players These are the four project partners that are working on the SOLAR NYC Project. These partners have signed an MOU outlining specific roles and responsibilities. Mayor’s Office of Long-Term Planning and Sustainability Sustainable CUNY on behalf of the City University of New York Hunter College - CUNY NYC Solar America Cities Advisory Board • Eight industry representatives • Ten non-profit solar/energy advocacy organizations • Six additional government agencies We work with these City agencies on various solar initiatives. They provide expertise on how to integrate solar into their processes and programs. Our utility and state partners. These groups provide financial and advisory support. 2
CUNY Players CARSI Team Sean C. Ahearn Yo Jin Ahn Jake Garcia Gordon Green Ylli Kellici Sustainable CUNY Tria Case Alison Klein Noah Ginsburg
LiDAR as input to Solar Insolation Model Create surface model for City Testing of resolution 1 foot Use LIDAR to examine roof morphology Useable roof area Use ESRI insolation tool Calibrate with installation data
LiDAR Coverage for New York City (1119 Tiles, > 15 billion points)
LiDAR Points Overlaid with Orthophoto and Signal Intensity View from North-East: Columbus Circle, Central Park South-West Manhattan, New York City
Quality Assurance of LiDAR • Minimum density of 8 points per m2 (QL 1) • Accuracy 9-10 cm RMSE Raw LAS format 1.2 including X, Y, Z and Intensity information • DSM • Bare Earth • Classification (ASPRS) • 1 Unclassified • 2 Bare Earth • 7 Noise • 12 Overlap
Ground Control for QA (2cm RMSE) • Manhattan: 198 points • Queens: 260 points • Brooklyn: 450 points • Bronx: 290 points • SI: 190
Ground Control for Manhattan Density of 0.74 = 8 pts per m2
RMS • LiDAR and 196 Ground Control Points • Average Difference = -1.64 cm (error in the Z of the airplane derived from airborne RTK GPS?) • RMSE = 6.69 cm
LiDAR Data Quality Check Points • Check ground survey points • placed non-ground 1. Artifacts or Outliers by Profile Analysis
QA 3 : Check Classification Bare Earth only Bare Earth and Unclassified Using just bare earth, an error of 4 feet was found due to misclassification
Application Example 1: Building Extraction Digital Surface Model Digital Elevation Model (1ft) Building Extraction
Example.2: Separation and Quantification of the Slant Rooftops from a LiDAR Point Clouds