Download
1 / 28
280 likes | 431 Views
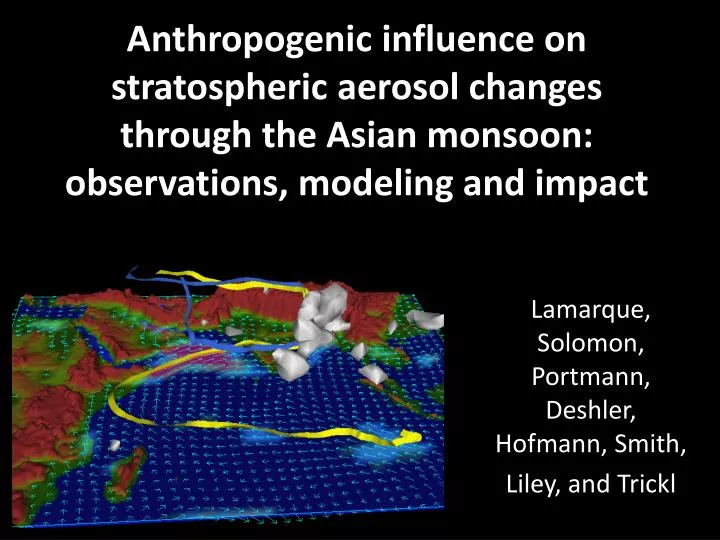
Anthropogenic influence on stratospheric aerosol changes through the Asian monsoon: observations, modeling and impact. Lamarque , Solomon, Portmann , Deshler, Hofmann, Smith, Liley , and Trickl. Background stratospheric aerosols and volcanic perturbations. Changes in the ‘background’?

E N D
Anthropogenic influence on stratospheric aerosol changes through the Asian monsoon: observations, modeling and impact Lamarque, Solomon, Portmann, Deshler, Hofmann, Smith, Liley, and Trickl
Background stratospheric aerosols and volcanic perturbations. Changes in the ‘background’? Deshler, T. (2008), A Review of Global Stratospheric Aerosol: Measurements, Importance, Life Cycle, and Local Stratospheric Aerosol, Atmos. Res., 90, 223-232.
Sources of the background sulfate layer? Crutzen (1976): OCS Chin and Davis, Weisenstein et al., Pitari, others: yes, but much more sulfur is needed. Aircraft emissions? Surface SO2 emissions? Other?
Hofmann et al., GRL, 2009 What is causing the increase in sulfate after the mid-1990s? Coal burning in China? But….how can this be when estimated total global sulfur emission has dropped….and AVHRR tropospheric optical depth isn’t going up globally……
Compare Ground-Based and SAGE Laramie Vs SAGE Zonal mean Mauna Loa Vs SAGE tropical mean
Large aerosol volume and extinction changes are seen in the lowermost stratosphere in many independent datasets 3-7%/yr, up to 10%/yr in some places 1998-2004 SAGE trend – avoids possibly significant eruptions (Manam was in 2005)
Large increases in aerosol are seen at various SAGE wavelengths from 1998-2004, and are confined to lower stratosphere
Lamarque et al., 2009: examine issue using CAM (NCAR model); tropospheric sulfur emissions updated by Smith; sulfur chemistry by Barth/Rasch et al. Considers emissions, transport, washout, etc. in troposphere Computes mass entering stratosphere See also Notholt et al., 2005 Sulfate in lower strat; special role of monsoon Sulfate in upper trop Emissions
The Asian Summer Monsoon is a Special Conduit to the Stratosphere
Tropospheric air
Niwano et al.: Very strong seasonal cycle in stratospheric aerosol, high values in NH summer coming into stratosphere in tropics; deficit at the entry point in winter.
SAGE anomaly in July compared to annual mean Model anomaly in July compared to annual mean Important fingerprints of the aerosol signal in season, altitude, latitude. Matches the expected pattern from the modeled coal emissions.
SAGE anomalies by season Model reproduces MAM, JJA, and SON well but does not get the maximum in DJF in the SH. Model transport, esp from NH to SH? Biomass burning? S. American monsoon? African monsoon?
Change from 1998-2004 Including all emissions Change from 1998-2004 Including all but China China contribution Good agreement between data and models in the NH…..some signal but too weak in SH
Surface chemistry plays key role in partitioning of NOx/NOy and ClO/Cly, very strong at LOW values of aerosol (and when wet!). More aerosol gives more ClO and more ozone loss. ≈50% more aerosol mass in 2008 compared e.g. to 1998 -> 35% more aerosol surface area -> 0.5-1% ozone loss at 15-18 km, cf about 5% depletion obs there since 1975. Therefore, Chinese aerosols have impeded ozone recovery that would otherwise have occurred by about 10-20% at this level. Other altitudes? Biggest aerosol changes are in the lowermost stratosphere. Future? Lower emissions likely in 2008 and 2009. Longer term?
Concluding Remarks • Evidence for changes in background stratospheric aerosol layer since the late-1990s, not attributable to volcanic eruptions, seen systematically in many different datasets. Hofmann et al. (2009) first to observe, ascribe to Chinese coal burning. • This study: importance of monsoon flow, see also Notholt et al. 2005 JGR re aerosols; also many papers on other constituents • Match between model and data fingerprints in altitude, latitude and season in the NH. • SH subtropics? Extratropics? • Suggests Chinese coal burning has made the chlorine in the stratosphere more effective for ozone loss, offsetting some of the gains that the Montreal Protocol would have achieved in the lower stratosphere in the past 10 years. Future? • Field experiments needed. Isotopic sulfur to derive SO2 source from coal?
Factors affecting lidar seasonal signals? Also Mauna Loa is a special case. This site is ‘tropical’ in summer but can correspond to ‘midlatitude’ air in winter Sedimentation? Yes, but small Swelling due to water vapor and temperature changes? Yes, but small outside the polar regions Tropical SAGE seasonal cycle shows the importance of seasonality at the entry point; this propagates upward and poleward (see Niwano et al.) Any column measurement will have a seasonal cycle, even an inert tracer
South polar aerosols: linked to synoptic conditions in troposphere, relationship to tropospheric cloud