Download
1 / 22
220 likes | 383 Views
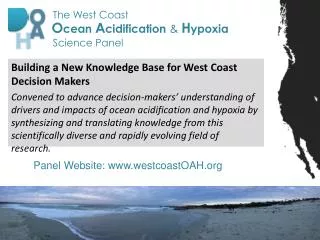
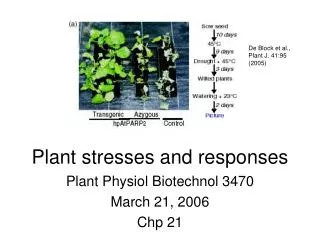
Biological responses to environmental stresses (hypoxia and acidification) Puget Sound Oceanography 2011. Climate projections. ‘Business as usual’ With emissions mitigation. Atmospheric. Ocean. pH along St. George California transect. Feely et al., 2002.

E N D
Biological responses to environmental stresses (hypoxia and acidification)Puget Sound Oceanography2011
Climate projections ‘Business as usual’ With emissions mitigation Atmospheric Ocean
pH along St. George California transect Feely et al., 2002
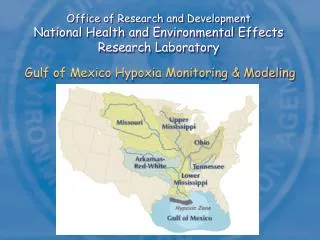
Calcium carbonate (as aragonite) saturation depths: from 1991-1996 cruises. Feely et al., 2002
February 2008 August 2008
Brittlestar adults increase calcification Oysters – decreased growth and calcification Wood et al, 2008 Beniash et al, 2010 Calcium content (g) Pteropod – shell dissolution Sea urchins – deformed larvae low pH Control 380ppm 3500ppm Limacina Krill – deformed eggs, reduced hatching pH 7.4 7.7 Control Net calcification Normal Deformed CaCO3 precipitated pH 8.1 pH 7.8 incubation time Fabry et al, 2008 Comeau et al. 2009 Kawaguchi et al, 2010 Kurihara et al, 2008
Biological effects on invertebrates: Highly variable, mostly (but not all) negative effects. Compensation (when present) shown to usually come at energetic expense. Mean effect size Doney et al, 2009
Lab experiments: low pH affects sensory systems; Leads to mortality in changes behavior: the field : Impacts on fish? Changes in prey: Salmon, herring, and mackerel prey:
Hypoxia • Primary effects: • mortality • physiological stress / impaired abilities • increased/decreased metabolic functions • Secondary effects: • habitat loss • decreased prey abundance • changes in predation / predation risk
Field observations of fish distributions – low abundances in hypoxic water
Vertical distributions of fish and some zooplankton change in response to hypoxia: May (oxic bottom water) Fish abundance Fish abundance Depth (Copepods) (Copepods) August (hypoxic bottom water) Fish abundance Fish abundance Depth (Copepods) (Copepods) Stanley and Wilson, 2004 Roman, 1993
Benthos Hypoxic ------------------------------------------------------------------------Oxic water column Diaz and Rosenberg (1995)
What drives changes in distributions? • Avoidance? • Direct mortality? • Indirect mortality (e.g., predation)? • Population-level changes (growth, reproduction)?
High mortality in hypoxic water. Species-specific thresholds copepods Roman (1993)
Avoidance: Behavioral trade-offs: Habitat preference vs. predation risk Fish larvae avoid hypoxia, increasing overlap with predators Oxygen (mg/l) 2 2 4 4 6 6 Oxygen (mg/l) Without predators Striped Bass predators Treatment: Without predators Striped Bass predators Pycnocline Pycnocline Predator avoidance
Effects of hypoxia depend on species: Physiology: Dissolved oxygen (mg/l) Predation rates: # of prey eaten Dissolved oxygen (mg/l) Breitburg 1994
Vertical movement of Aurelia under five oxygen conditions “Normal” Lots of vertical movement Each coloured line is the track of an individual specimen over a 1 h period. Thuesen et al. J Exp Biol 2005
Dissolved Oxygen Water temperature Multiple stressors: Habitat squeeze: high temperatures and low dissolved oxygen <5mg/l=stress <3mg/l=mortality >25C = stress and mortality August 18-20, 2003 Courtesy E. North, UMD, HPL
Main Stem Hood Canal oxygen patterns: Ocean end Hoodsport
Bioacoustic surveysHoodsport, September 2006 Night Day Surface zooplankton layer Fish separated from their prey