Download
1 / 22
220 likes | 393 Views
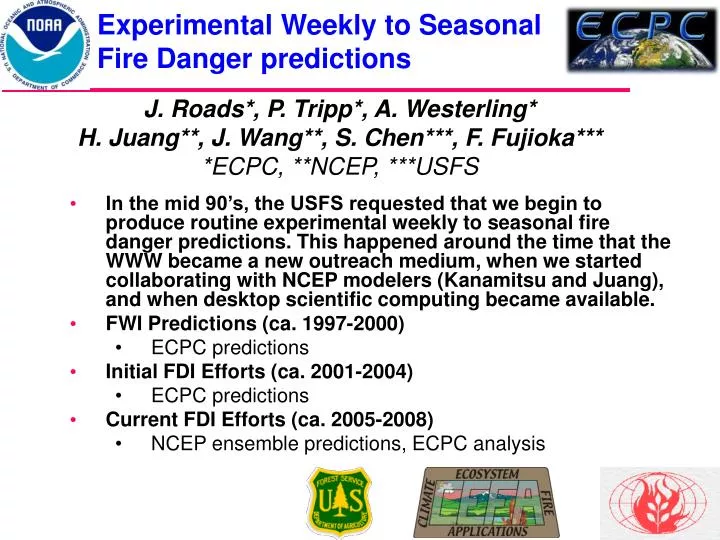
Experimental Weekly to Seasonal Fire Danger predictions. J. Roads*, P. Tripp*, A. Westerling* H. Juang**, J. Wang**, S. Chen***, F. Fujioka*** *ECPC, **NCEP, ***USFS.

E N D
Experimental Weekly to Seasonal Fire Danger predictions J. Roads*, P. Tripp*, A. Westerling* H. Juang**, J. Wang**, S. Chen***, F. Fujioka*** *ECPC, **NCEP, ***USFS • In the mid 90’s, the USFS requested that we begin to produce routine experimental weekly to seasonal fire danger predictions. This happened around the time that the WWW became a new outreach medium, when we started collaborating with NCEP modelers (Kanamitsu and Juang), and when desktop scientific computing became available. • FWI Predictions (ca. 1997-2000) • ECPC predictions • Initial FDI Efforts (ca. 2001-2004) • ECPC predictions • Current FDI Efforts (ca. 2005-2008) • NCEP ensemble predictions, ECPC analysis
ECPC Experimental Predictions • Atmospheric Forecast Models (ECPC G-RSM) • *GSM (Kalnay et al. 1996) T62L28, 192x94 Gaussian grid • *RSM97 (Juang et al. 1997) regional model, US, 60k 18 levels • Firedanger Models (USFS) • Fosberg Fireweather Index (Roads et al. 1997) • ECPC began making experimental, near real-time, routine weekly long-range global-regional predictions on Sept. 27, 1997 with GSM (150+ seasonal prediction ensemble archive used for initial paper). • The initial conditions and SST boundary conditions (climatology +persisted anomaly) for these experimental global to regional predictions come from the NCEP Global Data Assimilation (GDAS) 00UTC operational analysis. • For validation, we used 1 day GSM predictions, which are closely related to NCEP analyses, except we could more easily access our needed output in near real time. • 1-day forecast precipitation was a problem, we used instead the Xie-Arkin pentads interpolated to weekly and seasonal
Seasonal FWI Prediction/Validation Correlation Roads, J.O., S-C. Chen and F. Fujioka, 2001: ECPC’s Weekly to Seasonal Global predictions. Bull. Amer. Meteor. Soc, April 2001. Vol. 82, No. 4, 639-658.
National Fire Danger Rating System Structure cf. H. Reinbold Site Description 1300 LST Observation 24-Hour Observations Carryover Fuel Moistures (FM) Fuel Model Slope Class Live Fuel Types Climate Class Relative Humidity Temperature Cloudiness Precipitation Amount Max/Min RH Min Temp Precipitation Duration 100-Hour 1000-Hour Input Maximum Temperature Periodic Measurements Latitude Wind Speed Live Woody FM Average Annual Precipitation Fuel Stick Moisture Season Code & Greenness Factor (88) KBDI (88) Calculated 1-hr FM 10-hr FM 100-hr FM 1000-hr FM Live FM (88) Drought Fuel Contribution of dead FM to SC Contribution of dead FM to ERC Output Ignition Component IC Spread Component SC Burning Index BI Energy Release Component ERC Optional pathway September 19,2000
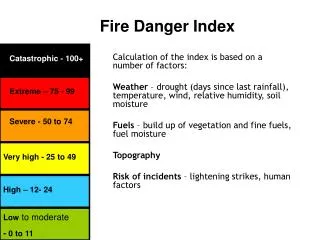
USFS Fire Danger Indices Roads, J., F. Fujioka, S. Chen, R. Burgan, 2005: Seasonal Fire Danger predictions for the USA. International Journal of Wildland Fire, Special Issue: Fire and Forest Meteorology, 14, 1-18. • SC is an index of the forward rate of spread at the head of a fire and is quite sensitive to wind speed. • ER is a number related to the available energy per unit area within the flaming front at the head of a fire. ER is not affected a by wind speed. • BI is a number related to the contribution of fire behavior to the effort of containing a fire. BI values represent the near upper limit to be expected if a fire occurs in the worst fuel, weather and topography conditions for this fuel type. SC and IC contribute to the BI. • IC is a rating of the probability that a firebrand will cause a fire requiring suppression action. SC is a component of IC. • KB is a stand-alone index that can be used to measure the affects of seasonal drought on fire potential. • FWI was derived by Fosberg (1978) who assumed constant fuel (vegetation=grass) characteristics. The FWI is most easily applied in practice and provides a first look at fire danger globally. It is a grassland approximation to BI.
ECPC Experimental Predictions • Atmospheric Forecast Models (ECPC G-RSM) • *GSM (Kalnay et al. 1996) T62L28, 192x94 Gaussian grid • *RSM97 (Juang et al. 1997) regional model, US, 60k 18 levels • Firedanger Models (USFS) • Fosberg Fireweather Index (Roads et al. 1997) • USFS Firedanger Indices (Roads et al. 2005) • We used our expanding historical archive of experimental, near real-time, routine weekly long-range global-regional predictions began on Sept. 27, 1997 with G-RSM (then 300+ prediction ensemble archive) for the new evaluations. • The initial conditions and SST boundary conditions (climatology +persisted anomaly) for these experimental global to regional predictions come from the NCEP Global Data Assimilation (GDAS) 00UTC operational analysis.
ECPC Firedanger predictions • The fire danger code depends upon the previous history. We must therefore use the best available data to drive our validating and initializing fire code • We use 1 day RSM predictions, which are closely related to NCEP analyses, except we can more easily access our own predictions in near real time. • Forecast precipitation is a problem. Fortunately, • Daily CPC precipitation at .25 degrees is now available in near-real time and this precipitation is used in place of predicted precipitation to update the fire danger code every day. • We validate the fire danger seasonal forecasts with the validating/initializing fire danger values and • Fire occurrence data (counts, area burned), which are available at coarse temporal (monthly) and spatial (1-deg.) (cf. Westerling) and this data was used to evaluate our fire danger predictions for the period 1997-2002.
Correlation Roads, J., F. Fujioka, S. Chen, R. Burgan, 2005: Seasonal Fire Danger predictions for the USA. International Journal of Wildland Fire, Special Issue: Fire and Forest Meteorology, 14, 1-18.
NCEP Global to Regional predictions • NCEP CFS T62L28 forces NCEP RSM (US 50 km 28 layers) • A continuous series of 1-day runs have been made from 1982-present, to provide (along with Higgins precipitation) the initialization/validation data for fire danger code • Ten 7-month predictions made monthly (beginning 2004) starting from 0000 and 1200 UTC of the first 5 days of current month and last 5 days of previous month. • Experimental prediction effort began Oct. 2004 and will continue for at least next 2 years • 3 hindcasts (the first two days of month and the last day of the previous month) initialized from the NCEP/DOE reanalysis for the same month but each year 1982-2004, or 23*3 mon. hindcasts. • more hindcast members may be added later if model not upgraded. • In fact, many sensitivity experiments are underway • a new land model, etc. • Please see poster 2.12 Juang and Wang for details
And updated fire statistics (States!) A higher resolution Fire Danger Code Model A Annually varying Western grasslands Model B Mature dense fields of brush Model C Open pine stands Model D Southeast coastal pine stands Model F California chaparral Model G Dense conifer with heavy litter Model H Short needled conifers Model L Perennial grasses Model N Florida sawgrass Model O Dense brushlike fuels of Southeast Model P Closted stands of long-needled southern pines Model Q Upland Alsaskan black spruce Model R Deciduous hardword Model S Alaskan tundra Model T Great Basin sagebrush grass Model U Closed stands of western long-needled pines
Forecast biases are fairly similar for all of the indices, we are still trying to track down which of the input variables is causing this behavior, we suspect humidity and pcp biases
US WestTime Series5 month running means. Validation (dark lines) and 2-month lead forecasts, 2+5 (red lines)Note summer has largest values
US West Anom. Time Series5 mon. running meanNote low frequency interannual variability reflected in fire danger indices, val. (black) and 2 mon. lead fcst (red lines)
Correlations of MMJJA validations with Mar. 1 forecastDifferent indices have slightly different preferred regions
Correlations of validations and ln acres burned are positive but low, we still need to find better relations between fire measures and fire danger indices.
Correlations of validations and fire counts seem higher and we will be investigating this measure as well as the acres burned.
The correlations for long range forecasts are similar but lower. Interestingly, all indices have skill in similar regions, may be related to skill of certain input variables.
Summary • The ECPC previously developed an experimental global/regional fireweather/firedanger prediction system • There was skill in predicting the primary meteorological inputs and fire danger indices out to 4 months for many places. • and modest skill in predicting US West fire acres burned • We are now working with NCEP and USFS to further develop US fire danger forecasts • Daily RSM products and observed precipitation from 1982-present now provide a much longer term fire danger initialization/validation set for an upgraded fire danger model and upgraded fire statistics • This validation set is used as the initial condition for 7-month and historical prediction fire danger ensembles (10+23x3). • Preliminary results for Mar. 1 forecast of MJJAS encouraging! Analysis is ongoing. Need to now include ensemble forecasts/hindcasts • We also need a global fire danger index andglobal measures of fire activity • Currently our only available global fire danger index is the FWI. More complex indices have been developed for individual regions. We need a global firedanger model synthesis. • Currently our only available fire activity data comes from Westerling’s manual efforts to gather historical info from US govt. and state agencies over the US West. Global historical measures of fire activity and characteristics are needed.