Download
1 / 52
520 likes | 662 Views
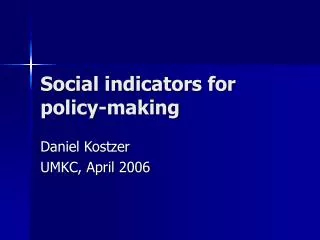
Social indicators for policy-making. Daniel Kostzer UMKC, April 2006. Introduction. The usefulness of social indicators for the design and definition of social policies Define the problems to address Define targeted populations Definition of plans, programs and tools.

E N D
Social indicators for policy-making Daniel Kostzer UMKC, April 2006
Introduction • The usefulness of social indicators for the design and definition of social policies • Define the problems to address • Define targeted populations • Definition of plans, programs and tools
Methods to meassure poverty • Indirect method • Household Income • Household Expenditures • Direct method • Unsatisfied basic needs indicators • Merging of methods • Katzman matrix
Indirect method • Definition of the poverty line • Definition of indigence line • The problem of circularity in the definition of the poverty line • Using consumption • Stable, but does not takes into account savings (future or past consumption) • Food expenditure • Using incomes • Volatile, defines entitlement, or potential well being
Incomes and expenditure according deciles of income distribution
Targeting Monotonicity Transference The index should point out who are the poor When a poor person looses its income the index should reflect that When a poor person transfers his income to other less poor but that remains poor Sen’s axioms on poverty indicators
Incidence of poverty Intensity of poverty Emerging indicators with the indirect method
The formula Calculate the area below the Lorenz curve L Simpson integration If Gini=0 perfect equality If Gini=1 absolute inequality Gini coefficient
Direct indicators (UBN) • The UBN indicators are direct since they emerge after direct observation of households and individuals • They do not reflect (necessary) monetary incomes of the households, but the level of satisfaction of certain needs.
Result indicators Input indicators Access indicators % of households with more than 3 members in each room % of houses without sanitation % of HH without running water % of HH with kids that do not assist to school Doctors per 1000 inhabitants Teachers per 1000 inhab. Public expenditure in health % of pop. With vaccination Free hospitals, schools School in X miles Types of direct indicators
Targeting and resources allocation • There should be a clear cut between the objective population and the eligibility criteria for the design of social policies • They can be universal • They can be targeted (a la WB) • Or can be combined
Tools for targeting • Categorical targeting • Age groups (kids, old) • Social groups or clusters (unemployed, poor, ethnic groups) • Regional • Proxy to means testing • Self-targeting • Incomes • Waiting lists, lines • Previous registration
Categorical targeting • Benefits are provided according to demand to every individual in a certain region, group of people or combination of both • Requires the categorization of regions according to the intensity of the desired indicator • It works well when there is high correlation between poverty and localization • It requires deep knowledge of the demographic composition of the region or groups • Combining the two systems provides the best results
Proxy of means testing • Assumes incomes to target, but also that there are registration problems due to under or miss declaration • Uses correlations between HH characteristics (some of them structural) and incomes (water, tv, car, type of house) • These models give a probability that a HH would have the income required to be into the program • The aplicability of the selection model depends on the relationship existing between the income and HH characteristics
Self selection Consist in defining incentives tight enough to avoid tempting other people than the intended to apply for the benefit • Low benefit • Work commitment • Waiting list and queues • Difficulties collecting the benefit
Labor market institutions and the concept of Decent Work Daniel Kostzer Kansas City, April 2006
Some figures… • open unemployment in the world is about 160 million, of whom some 53 million live in industrialized and transition economies. An additional 310 million do not have enough work; • it is currently estimated that there are some 530 million “working poor” earning less than enough to generate a family income of US$1 per day per capita to support the rest of the 1.2 billion who are living below the poverty line; • in recent years, the global economy has been creating about 40 million jobs a year, whereas there are 48 million new jobseekers annually; • over the next decade, the world’s labor force is projected to increase by 500 million workers, 97 per cent of whom will be in developing countries.
Somavia, 1999 • Decent work as productive toil in which rights are respected, security and protection are provided , as well as the possibility to take part in all decisions that may affect workers • Opportunities for women and men to obtain decent and productive work in conditions of freedom, equity, security and human dignity.
In simple words… • it is productive and secure work • it ensures respect of labor rights • it provides an adequate income • it offers social protection • it includes social dialogue, union freedom, collective bargaining and participation
Dimensions of decent work ILO 2000 • a) Opportunities for work; • b) Work in conditions of freedom; • Bonded labor, slave, child labor • c) Productive work • To ensure livelihoods of workers and families, as well to ensure sustainable development and competitiveness of enterprises and countries • d) Equity in work • Fair and equitable treatment and opportunities, avoidance of discriminations. • e) Security at work • Safeguarding health, pensions, livelihood, limits to the insecurity of loosing the job • f) Dignity at work • Voice and participation in decision making about their own working conditions
Measurement categories of decent work • Employment opportunities • Unacceptable work • Adequate earnings and productive work • Decent hours • Stability and security of work • Balancing work and family hours • Fair treatment in employment • Safe work environment • Social protection • Social dialogue and workplace relations • Economic and social context of decent work
Employment opportunities • Labor force participation rate • Employment/population ration • Unemployment rate • Youth unemployment rate • Time related underemployment rate • Share of wage employment in total employment
Unacceptable work • Children not in school by employment status • Children in wage employment or self-employed activities • Forced labor
Adequate earnings and productive work • Percentage of employed earning less than one half of median earnings • Average earnings • Excessive hours of work • Time related underemployment • Employees with recent job training
Decent hours • Excessive hours of work (over-employment) • Time related underemployment rate • Atypical or asocial work hours (or seasons)
Stability and security at work • Tenure less than one year • Temporary work • Intermittency of employment
Balancing work and family life • Employment rate for women with children under compulsory school age • Excessive hours of work • Flexibility of work and accommodation of family needs (sick child leave, birth leave, etc.) • Availability of child care • Workplace issues connected with population ageing
Fair treatment in employment • Occupational segregation by sex • Female share of employment in managerial and high level occupations • Female share of non-agricultural wage employment • Female/male earnings ration
Safe work • Fatal occupational injury rate • Labor inspection (number of inspectors) • Occupational injury insurance coverage • Excessive hours of work • Health insurance coverage • Occupational stress and injury rate
Social Protection • Public social security expenditure • Public expenditure on needs-based cash income support • Beneficiaries of cash income support (% of poor) • Share of population over 65 years benefiting from pension • Share of EAP contributing to pension fund • Average monthly pension/wages
Social dialogue • Union density rate • Collective wage bargaining coverage rate • Strikes and lockouts
Economic and social context of the decent work • Output per employed person • Growth of output • Inflation rate • Composition of employment per sector • Income inequality • Poverty • Informal economy employment
Labor market policies Active and passive interventions in the labor market
Labor market policies • Labor market policies (LMPs) are defined here as policies that provide income replacement and labor market integration measures to those seeking work, usually the unemployed, but also the underemployed and the employedwho are looking for better jobs.
Passive labor market policies • So-called “passive” policies are concerned with providing replacement income during periods of joblessness or job search • They are not conditional upon the integration to the labor market or training • unemployment insurance, • Unemployment assistance • early retirement
Active Labor Market Policies • “active” policies refer to labour market integration through demand or supply side measures • labor market training, • job creation in the form of public and community work programmes, • enterprise creation programmes • hiring subsidies. • They are usually targeted at specific groups facing particular labor market integration difficulties • younger and older people • women • disabled
Why ALMPs? • They are also an answer to the growing critique that pure income replacement policies might entail disincentives to work once unemployment becomes of longer duration.
Perception of insecurity and expenditure in ALPs (% of people worried to loose the job)
Types of ALMPs • Training • Public works, • Temporary work creation • Employment subsidies • Self employment • Small enterprise creation
Problems with ALMPs types: training • Insufficient levels of qualifications • Mismatch between supply and demand • Bad image of unemployed • Unclear knowledge • Disconnection between training institutions and employers • Overeducated unemployed • Gender, age, race bias
Problems: Public works, temporary job creation • Bad image of the long term unemployed, stigmatization of participants • End of measure equals being again into unemployment and poverty • Gender, age, race bias • Potential displacement from private sector??? • Difficulties to enforce the work conditionality
Problems: employment subsidies • Uncertain or no effects in the informal sector • High dead weight • Timing of the subsidy • Obsolete sectors
Problems: Self-employment, small-enterprise creation • Problems targeting • Access to further credit and expansion • Consultancy and training • Low productivity • Enlarging the informal sector???