Download
1 / 97
990 likes | 1.26k Views
Integrating Drinking Water into Watershed Protection. Beth Hall US EPA’s Office of Ground Water and Drinking Water. Sheree Stewart Oregon Department of Environmental Quality. Chris Crockett Philadelphia Water Department. Webcast sponsored by EPA’s Watershed Academy.

E N D
Integrating Drinking Water into Watershed Protection Beth Hall US EPA’s Office of Ground Water and Drinking Water Sheree Stewart Oregon Department of Environmental Quality Chris Crockett Philadelphia Water Department Webcast sponsored by EPA’s Watershed Academy
Introduction to Safe Drinking Water Act and Protecting Drinking Water Sources Office of Ground Water & Drinking Water U.S. Environmental Protection Agency, Washington, DC
Drinking Water Protection 101 • Roles and Responsibilities under Safe Drinking Water Act (SDWA) • Public Water Systems • SDWA Programs for Protection of Drinking Water Sources
Safe Drinking Water Act (SDWA) Standard Setting for Drinking Water Public Water Supply Supervision Drinking Water Source Protection Sole Source Aquifer Program Wellhead Protection Program Source Water Assessment Program Underground Injection Control Clean Water Act (CWA) Water Quality Standards Discharge Permits Waste Water Treatment Wetlands/ Non Point Source EPA’s Water Quality Laws
SDWA’s Multiple Barrier Approach to Public Health Protection Goal: Protect Current & Future Sources of Drinking Water Prevention Standards & Treatment Distribution System User -- Information
Roles & Responsibilities Under SDWA EPA sets health-based drinking water standards States implement and enforce standards Public water systems are the regulated entity Costs of compliance are passed through to consumers
EPASets Health-based Drinking Water Standards • Maximum Contaminant Levels or • Treatment Techniques • for more than 90 of the following: • Chemicals • Radionuclides • Microbiologicals • Disinfectants and disinfection by-products www.epa.gov/safewater/standards.html
Unregulated Unregulated Regulated No Formal Definition of “Emerging Contaminants” Contaminant Candidate List Process Initial Standard Setting CCL Regulatory Determination Process Review of Existing Standards Six Year Review Process
States Implement and Enforce Standards • Public Water Supply Supervision (PWSS) Programs • States with primacy (legal authority and capacity) implement drinking water program • For each new regulation, States must receive primacy authority - must adopt standards “at least as stringent” as federal standards • 49 States have primacy (WY, DC do not) EPA support for State drinking water programs The Public Water Supply Supervision Grant Program ($100M/yr for 1997 - 2003) Training/technical assistance and data systems Safe Drinking Water State Revolving Fund Enforcement Support
PublicWater Systems are the Regulated Entities
SDWA Protects Consumers Using Public Water Systems Types of Water Systems • Private Household Wells – not regulated • Public Water Systems (PWS’s) • Serve 15 connections or 25 people per day at least 60 days per year • PWS’s Include: • Community Water Systems • Serving year-round residents • Non-Community Water Systems • Non Transient -- serves 25 of same persons for 6 months/year (e.g., some schools, hospitals) • Transient -- serves 25 persons/day for 60 days/year (e.g., highway rest stops, restaurants) 157,000 Public Water Systems Population Served Source: SDWIS Feds 2006
Most People Receive Drinking Water from Large Community Water SystemsDemographics of Community Water Systems Population served by system size Size Distribution of Community Water Systems (68 Million) (233 Million) …yet most community water systems are small (84 %) > 3,300 people served Source: SDWIS Fed: 2006
Most of the US Population Receives Drinking Water from Surface Waters Distribution of Community Water Systems by Source Water Population Served by Drinking Water Source (101 million) (200 million) Population Served …but most small systems use ground water Source: SDWIS Fed 2006
Drinking Water Supply Terms • Public water supply – More than 15 connections or 25 people • Community water supply – year round residential populations • Non community water system • Non transient: since 1986 – regulated like CWS • Transient: minimum regulation (microbes and nitrate) • Can be privately or publicly owned • Gotham City and Joe’s Trailer Park: public water systems • USA Water Inc: privately owned, for profit, community water system • Hometown, Ohio: municipally owned, community water system • Maple City Park: municipally owned, non-community water system • Lake Country Fishing Camp: privately owned, non-community water system • Lobster Harbor Regional Water District : Public special authority serving four communities • PWS own and manage treatment and distribution systems • Source water areas may be controlled by ordinance or ownership • Wellhead area: area around a drinking water well (groundwater) • Watershed source area : watershed above a drinking water intake • State Drinking Water Programs / Clean Water Programs: may not be in same agency
EPA Drinking Water Protection Programs under SDWA • Sole Source Aquifer Program (1974) • Aquifers providing at least 50% of drinking water, with no other source • Any person or party can petition designation • Designation requires EPA review of Federally funded projects • 75 designated aquifers • Most designated in 1980’s; with new designations in WA and NJ • Wellhead Protection Program (WHPP) (1986) • Section 1428, requires assessment and protection for CWSs • All States have EPA approved WHPP programs • Some States have mandatory WHP for community water systems (MN, IN) • Some States have voluntary WHP (MI, IA) • Most incorporated WHP into Source Water Assessment Program (SWAP) after 1996
EPA Source Water Programs under SDWA • Underground Injection Control (1974) • Regulates construction and operation of disposal wells (a well is deeper than it is wide) • Five classes of wells • I - IV includes permitted oil and gas and hazardous waste, • Class V – shallow and low tech, over 600,000 • Class V well fundamentals • 1999 rule bans large capacity cesspools/septic tanks, and disposal wells at motor vehicle facilities in drinking water protection areas • Owners of shallow disposal wells permitted by rule • Inventory and proper operation in source water areas is critical
Source Water Assessment & Protection Program(SDWA Section 1453) • Purpose: comprehensive assessment / prioritization of potential threats for every PWS • 52,000 community water systems • 105,000 non community water systems • All States developed programs for EPA approval • Required extensive public involvement in program design • Built upon existing wellhead and watershed efforts • Funded through Drinking Water State Revolving Fund • Diversity from State to State / system type by system type • Protection activities, based on assessment findings, not required by SDWA -- most effective when implemented locally
Public distribution of findings Susceptibility analysis Contamination source inventory Delineation What is a Source Water Assessment?
Source Water Assessments • Delineation: the land area that could contribute water and pollutants to the water supply • Can be segmented into critical areas for more intensive attention • Ground water area based on underground flow • Results in a map – many States have GIS • Inventory: Location of significant potential sources of contamination • Point sources, land use • Available data, some field verification • Susceptibility: Relative risk of the water system to contamination • Hydrogeology • Type and location of potential sources • Intake or well location / integrity • Public Availability: Summaries, internet posting, upon request • Minimum requirement is summary and availability information in yearly consumer confidence reports (CCR)
SWPA Delineations for Ground Water-Based Systems 10 year time of travel wells 2 year time of travel 22
What Do Assessments Look Like Four Basic Required Elements Delineation, Inventory, Susceptibility, Public Availability States could mix and match these elements e.g., with Reliance of existing data vs. developing new data Different approaches based on system size Different approaches based on geologic vulnerability S I D S D D D I P S P S P State 2 State 1 • Diversity from System to System / State to State
Consumer Confidence Reports (CCR) • Required yearly reports from community water systems to consumers • Level (or range of levels) of any contaminant found in local drinking water, as well as EPA's health-based standard for comparison • Information about any violations of drinking water rule • Educational information e.g. cryptosporidium, possible sources of contamination, information resources • Source water information • Types of contamination that can be in drinking water • Lake, river, aquifer, or other source of drinking water • Summary of the susceptibility of the system to contamination • Instructions for getting a copy of the system’s assessment CCRs are an opportunity for utilities to highlight drinking water protection accomplishments
Source Water Protection Today • Source Water Assessments Completed by States: 95% • Source Water Assessments Completed by Tribes: 62% • Initial Implementation of SWP: 36% • Substantial Implementation of SWP: 20% Source: State reporting 2005 States Tribes Initial Substantial
Assessments are available: From State drinking water programs From public water systems Information about availability in yearly consumer confidence report Assessments can jumpstart local protection efforts: Watershed wide protection Ground water protection Utility / community level projects Targeting priorities (inspections, further assessment, public awareness, clean up, funding) Challenges Implementation of protection is not required Difficult to gauge progress Growing demand for water / land areas Moving from Assessment to Protection
National Source Water Priorities Building Partnerships and Leveraging Resources • National Source Water Protection Collaborative • Integration: CWA, UST, CERCLA, etc • Source Water Grants (NRWA, ASDWA, GWPC, etc) • State Revolving Funds (DWSRF and CWSRF) Addressing Priority Contamination • Identify most threatening sources • Combine resources where States share priorities Maintaining Safe and Sustainable Drinking Water Supplies • EPA Agency-level initiative: Sustainable Water Infrastructure • Preserve sources of drinking water • Consider water quantity
Website www.epa.gov/safewater/sourcewater State specific contacts and websites Searchable case study engine Sign up for EPA source water emails Source water resources from EPA and other organizations e.g. Updating and Enhancing Local Assessments (EPA) Funding for Source Water Activities (EPA) Smart Growth and Water Resources (EPA) Source Protection Handbook (Trust for Public Lands) Source Water Protection for Municipalities (New England Interstate) Training http://www.epa.gov/safewater/dwa/electronic/ematerials.html Resources
Integrating Drinking Water into Watershed Protection: Oregon’s Approach Sheree Stewart Drinking Water Protection Coordinator Oregon Department of Environmental Quality Portland, Oregon
Drinking Water Protection Process for Public Water Systems (PWS) DHS and DEQ contact PWS;GPS intake or well and request PWS assistance Activate community stakeholders, gather input, select a few strategies for protecting the source area DELINEATIONof the source area or “Drinking Water Protection Area” Determine Sensitivity INVENTORYfor “Potential Sources of Contamination” per guidance Source WaterASSESSMENTPhase Drinking Water PROTECTION Phase OPTIONAL: Consider writing a Drinking Water Protection Plan and gaining certification from DEQ DetermineSUSCEPTIBILITY to contamination Sensitivity + Potential Contaminants IMPLEMENT the strategies to prevent contamination SOURCE WATER ASSESSMENT REPORT Sent to PWS
Oregon’s Public Water Systems Receiving Source Water Assessments • Surface water - 142 systems • Ground water - 948 systems (community & nontransient noncommunity, i.e., schools and workplaces) • Total full assessments – 1090 systems • Transient noncommunity systems (motels, campgrounds, etc.) - 1040
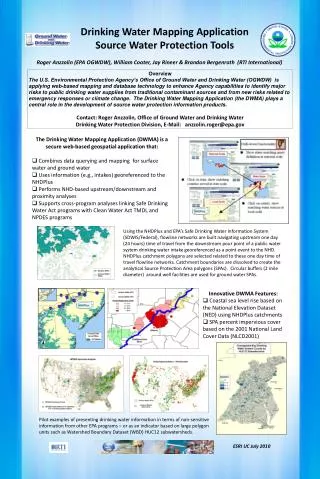
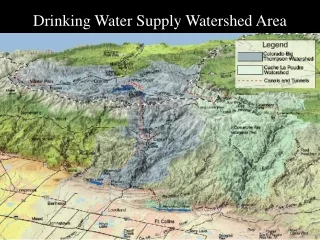
Procedure for Mapping Surface Water Source Area • Used Geographic Information System tools • Based on topography • Delineation of the boundaries of the watershed above intake, based on 5th-field Oregon Sub-Basins • Identification of consistent “sensitive areas” in each watershed
City of Grants Pass Drinking Water Protection Area and Drinking Water Intake- Surface Water Legend 4100342_Grants_Pass_SW_intake 35
Sensitive Areas Within Watersheds Used for Drinking Water • What are sensitive areas ? • Mapped areas where the potential of a contaminant reaching the source is higher, due to natural conditions or proximity • Sensitive areas for watersheds include: • Setbacks: 1000’ from centerline of water body, includes all perennial streams • High soil erosion potential (NRCS) • High permeability soils (alluvials mapped by USGS) • High runoff potential (Class D soils) • Landslide hazard areas
Oregon Drinking Water Source Areas for Surface Water Intakes
What We’ve Learned from Surface Water Assessments • Many of the surface water watersheds include multiple public water systems • Surface water watersheds contain many different stakeholders, land uses • Headwaters of most municipal watersheds are in forested land; lower portions primarily agriculture and some urban
What We’ve Learned from Surface Water Assessments • Approximate percentages of land uses within the surface water watersheds • US Forest Service 37% • BLM 11% • Commercial timber 22% • Private, agric, municipal 25%
Oregon’s SWA Inventory ResultsGroundwater Systems Top 5 Highest Potential Risks in 2-yr travel time • High Density Housing (>1 / .5 acre) • Sewer lines within 2-year TOT • Storm water, HHW, fertilizers, pesticides • Highways – Heavy Use • Petroleum, chemicals, herbicides • Large Capacity Septic Systems • Microbials, nitrate • Sewer Lines –Close Proximity • Fertilizers / nitrates, pesticides • Above Ground Tanks • Petroleum, chemicals
Oregon’s SWA Inventory ResultsSurface Water SystemsTop 5 Highest Potential Risks in Sensitive Areas • Harvested Forests • Sediments, pesticides, fertilizers • Crops – Irrigated • Fertilizers, pesticides, sediments • Grazing Animals (>5 large /acre) • Nitrates, bacteria, sediments • Above Ground Tanks • Petroleum, chemicals • Highways – Stream Crossings • Chemicals, petroleum
Converging Issues • Pharmaceuticals in Oregon waters • USGS data • Treatment effectiveness? • Pesticides in Oregon waters • USGS data – agricultural contributions • Focused collection events, education • New monitoring plan underway • Other WQ programs • TMDL, Oregon Plan, new standards
Reasons to Protect the Source Areas in Oregon • Increased emphasis on human health concerns • Emerging pollutants of concern-USGS data • Citizen input / agency budget requests • Population increasing • Higher water needs • More threats to watershed / ground water quality • Limited water rights availability
Oregon Drinking Water Protection Opportunities • Assessment Reports provide a tremendous amount of information to each community • Can be used to set local priorities for Oregon’s land use planning • Example county packet • GIS and database resources are already being used by other agencies/organizations • Other DEQ programs, Counties, Cities, USFS, BLM, ODOT, OERS, DLCD, ODF, ODA, others
Important Elements of Protecting Drinking Water Source Areas • Consider all components of water cycle: emphasize need to include groundwater • Include reduction of risk of loss • Water quality improvements = immediate fixes + long-term protection • Balance responsibilities in protection area • Many small changes vs. few major changes
Examples of Voluntary Risk Reduction Activities • Residential • Household hazardous waste collection • Improved septic system maintenance • Commercial / Industrial • Pollution prevention technical assistance • Mentoring & partnerships • Agricultural • Improved irrigation practices • Improved nutrient/pesticide practices • Forestry • Improved pesticide practices • Reduce sediment loading • Reduce road densities / increase stream buffers
Example Components of a Recent DW Protection Plan • Debris cleanup and regular inspection • Installation of gate to restrict access • Potential designation of certification under Forest Stewardship Council • Engage private owners • Install signs for hikers, bikers • Delay sensitive area harvest and seek grants to avoid ground disturbance