Download
1 / 23
230 likes | 423 Views
Identification of Extreme Climate by Extreme Value Theory Approach. Sutikno sutikno@statistika.its.ac.id. Statistics Department Faculty of Matematics and Natural Sciences Sepuluh November Institute of Techology Surabaya. Outline. Introduction.

E N D
Identification of Extreme Climate by Extreme Value Theory Approach Sutikno sutikno@statistika.its.ac.id Statistics Department Faculty of Matematics and Natural Sciences Sepuluh November Institute of Techology Surabaya
Introduction • Today we are shocked with many extraordinary events that we never imagined before because it never happens in our life. For the last 2 decades, we are familiar with flooding in big cities in Indonesia. • In agriculture, farmers frequenly complain about the unpredictable season that really harm their crop, so they can not harvest it well. • Thus, to minimalize the serious impacts of extreme climate, We need to learn the behaviour of this extreme climate. • So this subject is studied well in Extreme Value Theory or EVT.
Introduction Drought Flood in any location www. its.ac.id
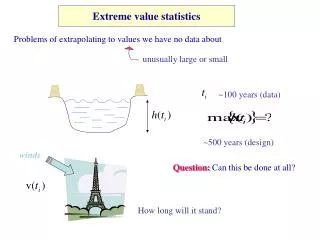
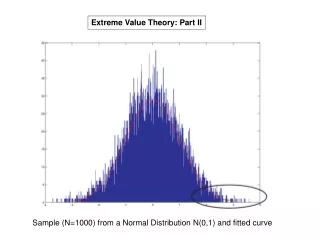
Extreme Value Theory Statistical methods for studying the behavior of the tail distribution. Distribution tail behavior indicates that in some cases the climate has a heavy-tail that is slowly declining tail of the distribution.As a result the chances of extreme value generated was very big. Heavy Tail Distribution Normal Distribution • Extreme is a very rare event
Value Extreme in Mantingan, Ngawi District, East Java Province Histogram of rainfall Plot Indentification of Normal distribution Heavy tail
Value Extreme in Ngale, Ngawi District, East Java Province Plot Indentification of Normal distribution Histogram of rainfall Heavy tail
Method of Determination of the Extreme Value There are two methods: • Block Maxima • Peaks Over Threshold
Block Maxima Method Rainfall (mm) Data is divided into blocks of a specific time period.Each block is further specified period formed the highest value.Highest data is the sample of extreme values. Period Generallized Extreme Value: Note: • = location parameter • σ=scala parameter • ξ= shape parameter (tail index)
Peaks Over Threshold (POT) • This method uses standard or threshold value. • Data that exceeds standard or threshold value is the sample of extreme value. Rainfall (mm) Period Generallized Pareto Distribution: Note: • σ=scala parameter • ξ= shape parameter
Determination of Threshold Value (u) • The selection of the value of u when there is a point that shows changes in slope. (1) Means Residual Life Plot Value u • Selecting some data, eg data above 90 percentile (2) The percentage method
RETURN LEVEL • Return level is the maximum value that is expected to exceed one time within a certain period . • Return Level GEV • Return Level GPD • xm= extreme values that occur once in the observation period m • δu = nu /n; nu = number of data that exceeds the threshold • n = number ofdata
Study Sites Study sites in Ngale and Mantingan Station at Ngawi District, East Java Province, IndonesiaRainfall data ten day (“dasaharian”), period 1989 to 2010. NGAWI
Identification of extreme values Annually Monthly Ma n t I n g a n N g a l e Extreme value
Result (1) • Extreme sample data by the method • of block maxima at Mantingan Stasion Parameter Estimation Period: DJF,MAM,JJA,SON • Identification of the Distribution Follow GEV Distribution: Weibull (ξ <0)
Result (2) • Extreme sample data by the method • of Peaks Over Thresshold at Mantingan Stasion Parameter Estimation Percentage Method • Identification of the Distribution Follow GPD Distribution: Exponential (ξ =0)
Result (3) • Extreme sample data by the method • of block maxima at Ngale Stasion Parameter Estimation Period: DJF,MAM,JJA,SON • Identification of the Distribution Follow GEV Distribution: Weibull (ξ <0)
Result (4) • Extreme sample data by the method • of Peaks Over Thresshold at Ngale Stasion Parameter Estimation Percentage Method • Identification of the Distribution Follow GPD Distribution: Exponential (ξ =0)
Result (5) Comparison of RMSE values between GEV and GPD POT (GPD) method is more appropriate in determining the extreme values. It is shown the value of RMSE POT method is smaller than the method of Block Maxima (GEV)
Result (6) Return Level and Estimation of extreme value rainfall (mm)
Summary • There are extremes climate (rainfall) at Ngale and Mantingan Station. • According to the RMSE criterion level return, Peaks over threshold method is more appropriate in determining the extreme values than the method of Block Maxima. • Return level at the Mantingan Station is 226 mm with an annual period, while at the Ngale Station is 210 mm with the same period
Further Research For further research, it is necessary to use other variables (covariates) in the return level. Multivariate extreme
Thanks You Sutikno sutikno@statistika.its.ac.id 085230203017