Download
1 / 21
210 likes | 337 Views
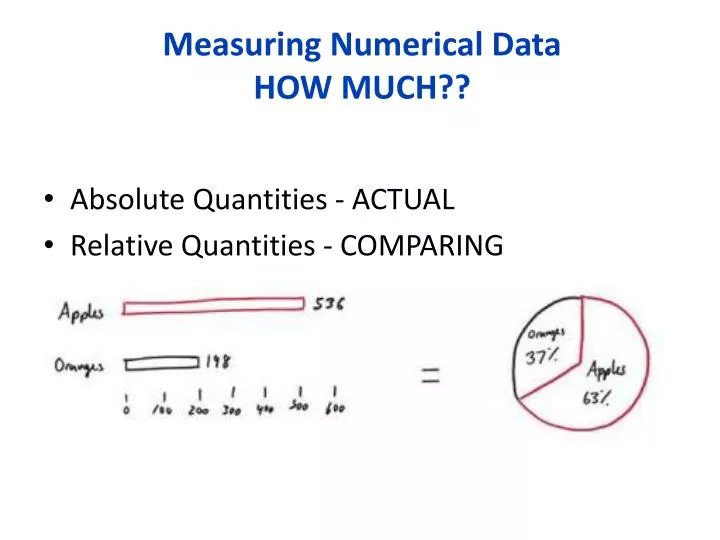
Measuring Numerical Data HOW MUCH??. Absolute Quantities - ACTUAL Relative Quantities - COMPARING. Types of Relative Quantities. Percent or Fraction: used when comparing a part to whole of the same variable Used to show relative change Part/whole

E N D
Measuring Numerical DataHOW MUCH?? • Absolute Quantities - ACTUAL • Relative Quantities - COMPARING
Types of Relative Quantities • Percent or Fraction: used when comparing a part to whole of the same variable • Used to show relative change • Part/whole • Rate: compare different types of variables (i.e. tickets per person, crimes per 1000 people) • Ratio: compare same type of variable from two sources
Types of Relative Quantities • Rates • Used to compare different types of variables • Examples • Miles per hour • Tickets per person • Crimes per 1000 people (HINT: What word is always in a statement using a rate?)
Percent Of Formula • Part = % Whole • Whole means the entire pie. • Part means one of the shaded regions or pieces of the pie.
Percentage Change • Percent Change Formula (find the percent) (New-Old)/Old = % • Find new value (given old value and the percent change) Old*(1+%)=New • Find old value (given new value and the percent change) Old = New 1 + %
Examples • The number of DVD players in homes in the United States increased dramatically from 1999 to 2001, from 5.4 million to 25.1 million. By how many percent did it rise from 1999 to 2001? • In 2001, there were 654 drive in theaters in the US, 77% fewer than in 1985. Approximately how many drive in theaters were there in 1985? • Enrollment at DePaul University has grown by 36% from 1990 to 2001. If the Fall 1990 enrollment was 21,363 students then what was the total enrollment in 2001? • A jacket was on sale for 40% off the original price of $79.99. I had an additional 15% off coupon for one item. What was the final price for the jacket?
Trendlines • Real World Data • Most data is not perfectly linear • Trendlines (also known as line of best fit and least squares line) • We can use the equation to make predictions • Is it a good fit? • Extrapolation • Predict the future • Constructing points between existing points is referred to as interpolation
Least Square Regression Line Example • y = mx + b • “Best Fit Line” aka “The least squares regression line”
The following table describes data for the number of people using a swimming pool over 8 days in summer and the corresponding maximum temperature (in degrees Celsius) on each day. a. Draw a scatterplot for this set of data.b. Trendline. Equation. R2c. Are we confident?
Equation for Exponential Functions • Like linear equations, there is also an equation for an exponential relationship • y = P*(1+r)x • P = a starting value (value of y when x=0) • r = percent change (written as a decimal) • x = input variable (usually time)
Change a number by percentage y = P * (1 + r) (increase) y = P * (1 - r) (decrease) • Y is the ending value • P is starting value and • r is percent change • Calculate in Excel
EXAMPLES • The population of Jacksonville was 3,810 in 2007, and is growing at an annual rate of 3.5%. If this growth rate continues, what will be the approximate population in 2020? • How can we solve this with an Excel spreadsheet? • How can we solve this with an equation?
TYPES OF GRAPHS • Pie Charts
X-Y Graphs (Line Graphs) • Use X-Y graphs when you have a lot of data points • The x-axis and the y axis has numerical data • This is also called a X-Y Scatter graph with a straight line in Excel • Don’t use the “line graph” function in Excel because it treats x-axis data as “categorical” and not numerical • This causes the line not to come out right
X-Y Graphs (Line Graphs) Frequency of GPAs of Students in Math 101 Number of Students • Both variables (x and y) are numerical. • Connect the data points to create the line