Download
1 / 38
380 likes | 601 Views
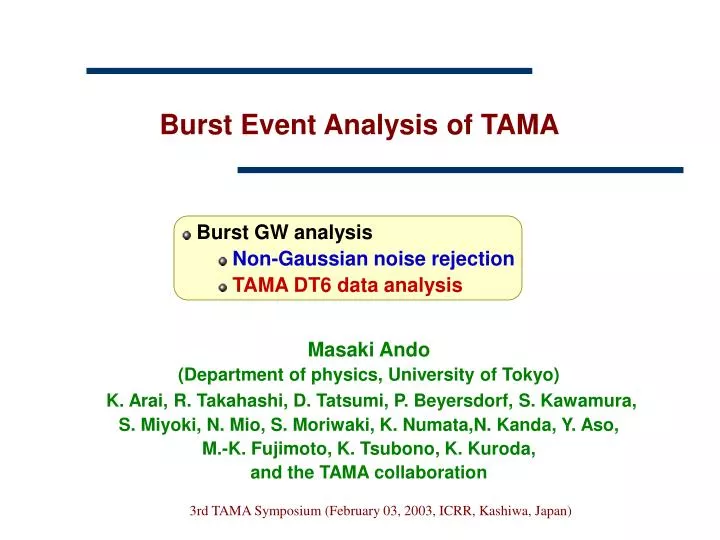
Burst Event Analysis of TAMA. Masaki Ando (Department of physics, University of Tokyo) K. Arai, R. Takahashi, D. Tatsumi, P. Beyersdorf, S. Kawamura, S. Miyoki, N. Mio, S. Moriwaki, K. Numata,N. Kanda, Y. Aso, M.-K. Fujimoto, K. Tsubono, K. Kuroda, and the TAMA collaboration.

E N D
Burst Event Analysis of TAMA Masaki Ando (Department of physics, University of Tokyo) K. Arai, R. Takahashi, D. Tatsumi, P. Beyersdorf, S. Kawamura, S. Miyoki, N. Mio, S. Moriwaki, K. Numata,N. Kanda, Y. Aso, M.-K. Fujimoto, K. Tsubono, K. Kuroda, and the TAMA collaboration • Burst GW analysis • Non-Gaussian noise rejection • TAMA DT6 data analysis 3rd TAMA Symposium (February 03, 2003, ICRR, Kashiwa, Japan)
Contents • Introduction • Burst GW analysis • Burst filters • Excess filter and non-Gaussian noises • Rejection of non-Gaussian noises • Concept, implementation • Data analysis with TAMA300 data • TAMA data • Noise reduction, burst event rate • Summary 3rd TAMA Symposium (February 03, 2003, ICRR, Kashiwa, Japan)
Introduction (1)- Gravitational wave search - • Chirp GW signal(from compact binary inspirals ) • Well-predicted waveform Matched Filtering (correlation with templates) Distinguishable from non-Gaussian noises • Continuous GW signal(from rotating neutron stars) • Well-predicted waveform Simpler waveforms (modulated sine waves) Almost stationary Noise reduction with Long-term Integration, narrow band analysis • Burst GW signal(from Stellar core collapses) • Poorly-predicted waveforms Cannot use matched filtering to get optimal SNR Look for ‘something unusual’ 3rd TAMA Symposium (February 03, 2003, ICRR, Kashiwa, Japan)
+ (Non-Gaussian noise) Non-Gaussian events • Burst GW signals • Non-Gaussian noise Detection efficiency is limited by non-Gaussian noises Non-Gaussian noise rejectionis indispensable Introduction (2)- Non-Gaussian noises - • Main output signal of a detector = (Stationary, Gaussian noise) + (Burst GW signals) Stable operation Non-Gaussian events Burst filters: Look for and sensitive to Unpredicted and non-stationary waveforms 3rd TAMA Symposium (February 03, 2003, ICRR, Kashiwa, Japan)
Non-Gaussian noise rejection with noise behavior, … Time scale of non-Gaussian events Introduction (3)- Non-Gaussian noise reduction - • Non-Gaussian noise rejection • Single detector • Detector improvement • Data processing (Signal behavior, auxiliary signals) • Correlation with other detectors • Other GW detectors • Other astronomical channels (Super novae, Gamma-ray burst, etc.) In this talk … 3rd TAMA Symposium (February 03, 2003, ICRR, Kashiwa, Japan)
Contents • Introduction • Burst GW analysis • Burst filters • Excess filter and non-Gaussian noises • Rejection of non-Gaussian noises • Concept, implementation • Data analysis with TAMA300 data • TAMA data, • Noise reduction, burst event rate • Summary 3rd TAMA Symposium (February 03, 2003, ICRR, Kashiwa, Japan)
Burst filters (1)- Proposed filters for burst GW - • Proposed filters for burst wave --- look for unusual signals • Power in time-frequency plane • Excess power: Phys. Rev. D 63, 042003 (2001) • Clusters of high-power pixels in the time-frequency plane : Phys. Rev. D 61, 122002 (2000) • Correlation with typical waveform • Slope detector: Phys. Rev. D 63, 042002 (2001) • Correlation with single pulse: Phys. Rev. D 59, 082002 (1999) Evaluate with certain statistics set thresholds record large events 3rd TAMA Symposium (February 03, 2003, ICRR, Kashiwa, Japan)
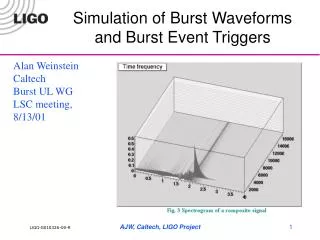
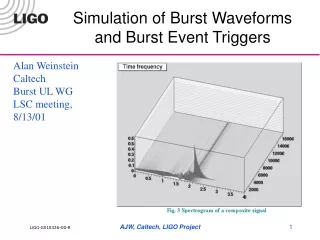
Raw Data (time series) Time- Frequency plane (spectrogram) Total power in given T-F region Signal !!! Effective if time-frequency range of the signal is known Burst filters (2)- Excess power filter - • Excess power filter • Total power in selected time-frequency region 3rd TAMA Symposium (February 03, 2003, ICRR, Kashiwa, Japan)
Far from Gaussian Many non-Gaussian noises Burst filters (3)- Analysis results: excess power filter - • Burst wave analysis results • Event rate (Integrated histogram) Excess power analysis • TAMA DT6 (1000hours, 2001) • Simulated Gaussian noise Burst event rate of TAMA 3rd TAMA Symposium (February 03, 2003, ICRR, Kashiwa, Japan)
Many Signals ??? However … still have sensitivity to Huge Non-Gaussian noises Non-Gaussian noise rejection is indispensable Burst filters (4)- Non-Gaussian noises - • Main output signal of a detector = (Stationary, Gaussian noise) + (Non-Gaussian noise) + (Burst GW signals) Stable operation Non-Gaussian events Burst filters: Sensitive to short burst events • Wide frequency bandwidth • Short average time Total power in given T-F region 3rd TAMA Symposium (February 03, 2003, ICRR, Kashiwa, Japan)
Contents • Introduction • Burst GW analysis • Burst filters • Excess filter and non-Gaussian noises • Rejection of non-Gaussian noises • Concept, implementation • Data analysis with TAMA300 data • TAMA data, • Noise reduction, burst event rate • Summary 3rd TAMA Symposium (February 03, 2003, ICRR, Kashiwa, Japan)
Numerical simulation of super novae • T. Zwerger, E. Müller, Astronomy & Astrophysics, 320 (1997), 209. • 78 gravitational waveforms • Various waveforms • Do not cover all conditions Not suitable for templates Non-Gaussian noise rejection (1) - Target selection - • Non-Gaussian noise reduction • Some assumptions are required • Selection of analysis targets super nova explosions • Common characteristics • Pulse-like waveform • Large power in short time 3rd TAMA Symposium (February 03, 2003, ICRR, Kashiwa, Japan)
Non-Gaussian noise rejection (2) - Concept - • Non-Gaussian noise reduction Distinguish GW signal from non-Gaussian noises with time-scale of the ‘unusual signals’ GW from gravitational core collapse < 100 msec, Noise caused by IFO instability > a few sec • 2 statistics in detector output • Averaged noise power • 2nd-order moment of noise power Estimate parameter : ‘GW likelihood’ Reduce non-Gaussian noises without rejecting GW signals 3rd TAMA Symposium (February 03, 2003, ICRR, Kashiwa, Japan)
Time scale of GW signal, noise Long Short Non-Gaussian noise rejection (3) - Noise evaluation with C1-C2correlation - • Detector output model • Correlation plot: C1 and C2 • Stable operation • Short pulse • Degradation of noise level many burst noises = (Stationary, Gaussian noise) + (Non-Gaussian noise) + (Burst GW signals) 3rd TAMA Symposium (February 03, 2003, ICRR, Kashiwa, Japan)
Non-Gaussian noise rejection (4) - Theoretical curve in correlation plot - • Data model Gaussian noise + GW signals Theoretical curve in correlation plot (Consistent with simulation results) • Distance (D) to the curve --- Likelihood to be GW signal Reduce non-Gaussian noise Without rejecting GW signals • Monte-Carlo simulation • Consistent with theoretical prediction • Estimate False Dismissal Rate set thresholds Theoretical curve C1 C2 3rd TAMA Symposium (February 03, 2003, ICRR, Kashiwa, Japan)
Spectrogram Evaluation Rejection, Total power Non-Gaussian noise rejection (5)- Data processing - • Data Processing • Calculate Spectrogram by FFT • Extract a certain time-frequency region to be evaluated • Evaluate GW likelihood at each frequency (Threshold Dth ) • Reject given time region if it has large ‘non-GW like’ ratio (Threshold Rth) • Calculate total power for given T-F region • ‘Filter’ outputsfor each time chunk • Total power in selected time-frequency region • ‘Stable time’ or detector ‘Dead time’ Raw data 3rd TAMA Symposium (February 03, 2003, ICRR, Kashiwa, Japan)
Contents • Introduction • Burst GW analysis • Burst filters • Excess filter and non-Gaussian noises • Rejection of non-Gaussian noises • Concept, implementation • Data analysis with TAMA300 data • TAMA data • Noise reduction, burst event rate • Summary 3rd TAMA Symposium (February 03, 2003, ICRR, Kashiwa, Japan)
TAMA300 data evaluation (1)- Data Taking 6 - • Data Taking 6 (August 1- September 20, 2001, 50 days) Over 1000 hours’ observation data 3rd TAMA Symposium (February 03, 2003, ICRR, Kashiwa, Japan)
TAMA300 data evaluation (2)- Time-series data - • Data Taking 6 time-series data (Average time: 3.2sec, Bandwidth : 500Hz) Large non-Gaussian noises(mainly in daytime) Noise level [ /Hz1/2] Typical noise level (6min. Avg.) Time [hour] 3rd TAMA Symposium (February 03, 2003, ICRR, Kashiwa, Japan)
TAMA300 data evaluation (3) - Selection of parameters - • Selection of time window, frequency band • Time window: smaller larger S/N • … Lower frequency resolution (Easily affected by AC line etc.) • Frequency band: wider larger S/N • … Use frequency band with larger noise level • Determination of thresholds • 2 thresholds: • Distance to theoretical curve: Dth , • Ratio of non-Gaussian frequency band: Rth • Rejection efficiency: Depends on characteristics of non-Gaussian noise • Should be optimized depending on noise behavior 3rd TAMA Symposium (February 03, 2003, ICRR, Kashiwa, Japan)
TAMA300 data evaluation (4) - Typical noise level of TAMA300 - • Typical noise level of TAMA300 during DT6 About 7x10-21 /Hz1/2 • Selection of frequency bands for analysis Δf=500 [Hz] 3rd TAMA Symposium (February 03, 2003, ICRR, Kashiwa, Japan)
TAMA300 data evaluation (5)- time-series data - • Data Taking 6 time-series data Confirm reduction of non-Gaussian noises(in daytime) Rejected data : 10.7% (False dismissal rate < 1ppm) Noise level [ /Hz1/2] Time [hour] 3rd TAMA Symposium (February 03, 2003, ICRR, Kashiwa, Japan)
Effective Noise reduction Reduction : 1/1000 TAMA300 data evaluation (6)- event rate - • Event rate (Integrated histogram) • Reduction ratio (total : 10.7%) • Small events < 1.1 x10⁻²⁰ /Hz1/2 : 1.7% • Large events > 1.7x10⁻²⁰ /Hz1/2 : 86.3% 3rd TAMA Symposium (February 03, 2003, ICRR, Kashiwa, Japan)
TAMA300 data evaluation (7)- event rate - • Event rate for burst GW • hrms: 3x10-17 (10msec spike) 10-2 events/hour • 30 times better in stable hours Cont. stable 12 hours 3rd TAMA Symposium (February 03, 2003, ICRR, Kashiwa, Japan)
Summary • Non-Gaussian noise evaluation • Distinguish GW signal from non-Gaussian noises with time scale of the ‘unusual signal’ • Reduce non-Gaussian noises without rejection GW signals • Better upper limits, detection efficiency • Non-Gaussian noise reduction with TAMA data • Data quality evaluation • Reduce non-Gaussian noise: 1/1000 • Upper limit for burst GW signal hrms~3x10-17 10-2 events/hour (10msec pulse, non-optimized) 3rd TAMA Symposium (February 03, 2003, ICRR, Kashiwa, Japan)
Current and Future Tasks • Non-Gaussian noise rejection with main signal • Selection of analysis parameters (Data length, Frequency band, Thresholds) • Other statistics • Rejection efforts • Single detector • Detector improvement • Data processing (Signal behavior, auxiliary signals) • Correlation with other detectors • Other GW detectors • Other astronomical channels (Super novae, Gamma-ray burst, etc.) • Real-time analysis Will be implemented soon… 3rd TAMA Symposium (February 03, 2003, ICRR, Kashiwa, Japan)
Non-Gaussian noise rejection - Advantages - • Advantages • Simply calculated parameters • Averaged power, 2nd order moment • Robust for change (signal amplitude, waveform, noise level drift) 3rd TAMA Symposium (February 03, 2003, ICRR, Kashiwa, Japan)
TAMA300 data evaluation - Estimation of averaged noise level - • Estimation of averaged (typical) noise level • Critical for non-Gaussian noise rejection • Calculated for each frequency band • Use latest stable data Noise level < typical x Gaussianity < 0.1 • Average for 6 min. 3rd TAMA Symposium (February 03, 2003, ICRR, Kashiwa, Japan)
TAMA data analysis- Data distribution and analysis - 3rd TAMA Symposium (February 03, 2003, ICRR, Kashiwa, Japan)
Non-Gaussian noise rejection- Hardware and software - • Computer for analysis • Beowolf PC cluster • Athlon MP2000+ 20CPU, 10 node • Storage : 1TByte RAID 60GByte local HDDs/each node • Memory : 2GByte • Connection : Gigabit ethanet • Software • OS : Red Hat Linux 7.2 • Job management : OpenPBS (Portable Batch-queuing System) • for parallel processing : MPI • Compiler : PGI C/C++ Workstation • Software : Matlab, Matlab compiler 3rd TAMA Symposium (February 03, 2003, ICRR, Kashiwa, Japan)
Non-Gaussian noise rejection- Computation time - • Analysis time: 90% is for spectrogram calculation • 1 file (about 1 mon. data) 2560 FFT calculations (N FFT = 212 ) • Distributed calculation with several CPUs (not a parallel computation) • Assign data files to each CPU • Minimum load for network • Easy programming, optimization • Benchmark test • Degradation with many CPUs • Data-readout time from HDD • Limited memory bus in each node 3rd TAMA Symposium (February 03, 2003, ICRR, Kashiwa, Japan)
Reduction: about 1/10 TAMA300 data evaluation - histogram - • Histogram of noise level Reduction of non-Gaussian noises 3rd TAMA Symposium (February 03, 2003, ICRR, Kashiwa, Japan)
TAMA300 data evaluation - Threshold selection - • Event number for threshold Rth 3rd TAMA Symposium (February 03, 2003, ICRR, Kashiwa, Japan)
Non-Gaussian noise evaluation - Evaluation parameters - • Statistics in detector output • Averaged power (normalized by a typical noise power) stationarity of data • Higher moment of noise power Gaussianity of data • Stationary and Gaussian noises Pj : exponential distribution 3rd TAMA Symposium (February 03, 2003, ICRR, Kashiwa, Japan)
Non-Gaussian noise evaluation - Distance from theoretical curve - • Theoretical calculation • Detector output Gaussian noise + Non-Gaussian noise C1,C2, variance (S1,S2), covariance (S12) function of signal amplitude (α) C1, C2with certain amplitude (α) 2-D Gaussian distribution • Distance from the curve (deviation) • Search α for minimum D 3rd TAMA Symposium (February 03, 2003, ICRR, Kashiwa, Japan)
Burst wave analysis - proposed filters - • Excess power • Excess power statistic for detection of burst sources of gravitational radiation Warren G. Anderson, Patrick R. Brady, Jolien D. E. Creighton, and Éanna É. Flanagan (University of Texas, University of Wisconsin-Milwaukee etc), Phys. Rev. D 63, 042003 (2001) • Slope detector • Efficient filter for detecting gravitational wave bursts in interferometric detectors Thierry Pradier, Nicolas Arnaud, Marie-Anne Bizouard, Fabien Cavalier, Michel Davier, and Patrice Hello (LAL, Orsay), Phys. Rev. D 63, 042002 (2001) • Clusters of high-power pixels in the time-frequency plane • Robust test for detecting nonstationarity in data from gravitational wave detectors Soumya D. Mohanty (Pennsylvania State University), Phys. Rev. D 61, 122002 (2000) • Correlation with single pulse • Detection of gravitational wave bursts by interferometric detectors Nicolas Arnaud, Fabien Cavalier, Michel Davier, and Patrice Hello (LAL, Orsay), Phys. Rev. D 59, 082002 (1999) 3rd TAMA Symposium (February 03, 2003, ICRR, Kashiwa, Japan)
Burst wave analysis - Excess power - • Excess power • Set : start time , interval (contain N data points), and frequency band • FFT of these data points • Sum up power for determined frequency band • Estimate probability for the resultant power • Assumption : • distribution with degree of freedom • normalized data (unity standard deviation) • Record ‘event’ if probability is significant • Repeat with other , , 3rd TAMA Symposium (February 03, 2003, ICRR, Kashiwa, Japan)
Burst wave analysis - Slope Detector, TF Cluster - • Slope Detector • Linear fitting for N data points (y=at+b) • Evaluate with a and b • TF Cluster • Calculate spectrogram • Set a threshold for noise power • Identify clusters in time-frequency plane • Calculate total power of clusters, and compare with a threshold 3rd TAMA Symposium (February 03, 2003, ICRR, Kashiwa, Japan)