Download
1 / 1
10 likes | 103 Views
:the difference between predicted and measured values of tortuosity. :the number of measured values. : tortuosity at water saturation. : soil texture parameters. : threshold water content. Evaluation of Tortuosity Models for Predicting Solute Diffusion in Unsaturated Soils

E N D
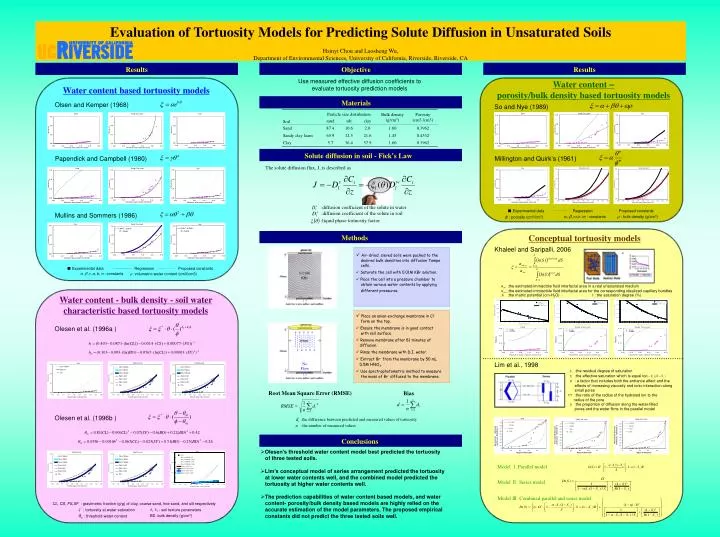
:the difference between predicted and measured values of tortuosity :the number of measured values : tortuosity at water saturation : soil texture parameters : threshold water content Evaluation of Tortuosity Models for Predicting Solute Diffusion in Unsaturated Soils Hsinyi Chou and Laosheng Wu, Department of Environmental Sciences, University of California, Riverside, Riverside, CA Results Objective Results Use measured effective diffusion coefficients to evaluate tortuosity prediction models Water content –porosity/bulk density based tortuosity models Water content based tortuosity models Materials Olsen and Kemper (1968) So and Nye (1989) Solute diffusion in soil - Fick’s Law Papendick and Campbell (1980) Millington and Quirk’s (1961) The solute diffusion flux, J, is described as :diffusion coefficient of the solute in water ■ Experimental data Regression Proposed constants :diffusion coefficient of the solute in soil : constants : bulk density (g/cm3) Mullins and Sommers (1986) : porosity (cm3/cm3) :liquid phase tortuosity factor Methods Conceptual tortuosity models Khaleel and Saripalli, 2006 • Air-dried, sieved soils were packed to the desired bulk densities into diffusion Tempe cells. • Saturate the cell with 0.01M KBr solution. • Place the cell into a pressure chamber to obtain various water contents by applying different pressures. ■ Experimental data Regression Proposed constants 0.01M KBr a, b, n : constants : volumetric water content (cm3/cm3) :the estimated immiscible fluid interfacial area in a real unsaturated medium :the estimated immiscible fluid interfacial area for the corresponding idealized capillary bundles :the matric potential (cm-H2O) : the saturation degree (%) Water content - bulk density - soil water characteristic based tortuosity models • Place an anion-exchange membrane in Cl- form on the top. • Ensure the membrane is in good contact with soil surface. • Remove membrane after 81 minutes of diffusion. • Rinse the membrane with D.I. water. • Extract Br- from the membrane by 50 mL 0.5M HNO3. • Use spectrophotometric method to measure the mass of Br- diffused to the membrane. Olesen et al. (1996a ) Lim et al., 1998 No Flow :the residual degree of saturation :the effective saturation which is equal to : a factor that includes both the entrance effect and the effects of increasing viscosity and ionic interaction along small pores Root Mean Square Error (RMSE) Bias :the ratio of the radius of the hydrated ion to the radius of the pore :the proportion of diffusion along the water-filled pores and the water films in the parallel model Olesen et al. (1996b ) Conclusions • Olesen’s threshold water content model best predicted the tortuosity of three tested soils. • Lim’s conceptual model of series arrangement predicted the tortuosity at lower water contents well, and the combined model predicted the tortuosity at higher water contents well. • The prediction capabilities of water content based models, and water content- porosity/bulk density based models are highly relied on the accurate estimation of the model parameters. The proposed empirical constants did not predict the three tested soils well. Model Ⅰ.Parallel model Model Ⅱ. Series model Model Ⅲ. Combined parallel and series model CL, CS, FS,SF : gravimetric fraction (g/g) of clay, coarse sand, fine sand, and silt respectively BD :bulk density (g/cm3)