Download
1 / 10
100 likes | 215 Views
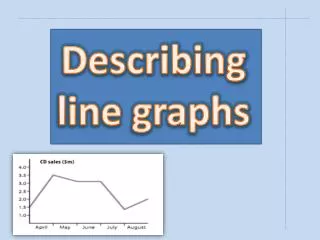
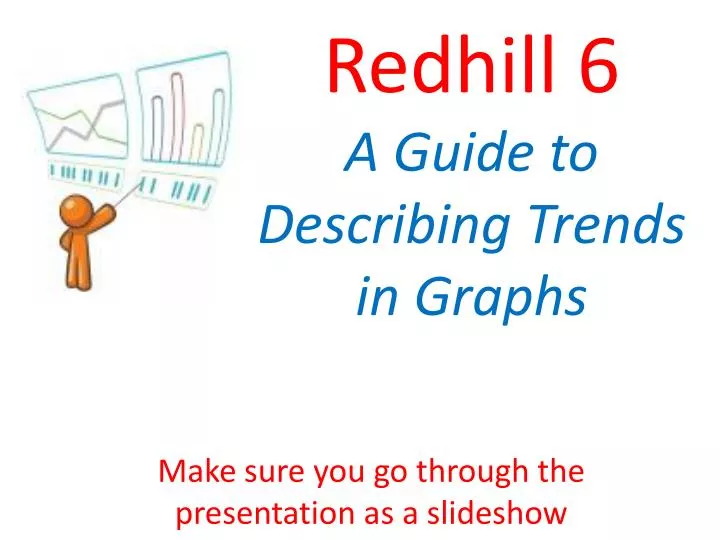
Redhill 6 A Guide to Describing Trends in Graphs. Make sure you go through the presentation as a slideshow. Y. As X increases, Y increases. X. 5. 10. 5. 10. Y. As X increases, Y increases. X. 5. 10. 5. 10. As X increases, Y increases slowly. As X increases, Y increases quickly.

E N D
Redhill 6 A Guide to Describing Trends in Graphs Make sure you go through the presentation as a slideshow
Y As X increases, Y increases. X 5 10
5 10 Y As X increases, Y increases. X
5 10 5 10 As X increases, Y increases slowly. As X increases, Y increases quickly.
Y As X increases, Y decreases. X 5 10
Y As X increases, Y decreases. X 5 10
5 10 5 10 As X increases, Y decreases slowly. As X increases, Y decreases quickly.
Y As X increases, Y stays constant X 5 10
Y As X increases, Y stays constant, but then decreases slowly then quickly X
As X increases, Y increases quickly, then decreases slowly and increases slowly but eventually decreases quickly. Y X