Download
1 / 1
10 likes | 107 Views
Parameter. Parameters. Gender. Male (n=132). UK study. Female (n=123). USM study. 90% CI for lower limit. Our Study. 90% CI for upper limit. WBC (X 10 9 /I). 4.0 – 9.6. 4.2 – 11.9. M = 3.7 - 4.6 F =3.8 - 4.8. M = 8.9 - 9.7 F = 11.0 - 12.3. HB (g/dl). M F. 13.7 – 17.2

E N D
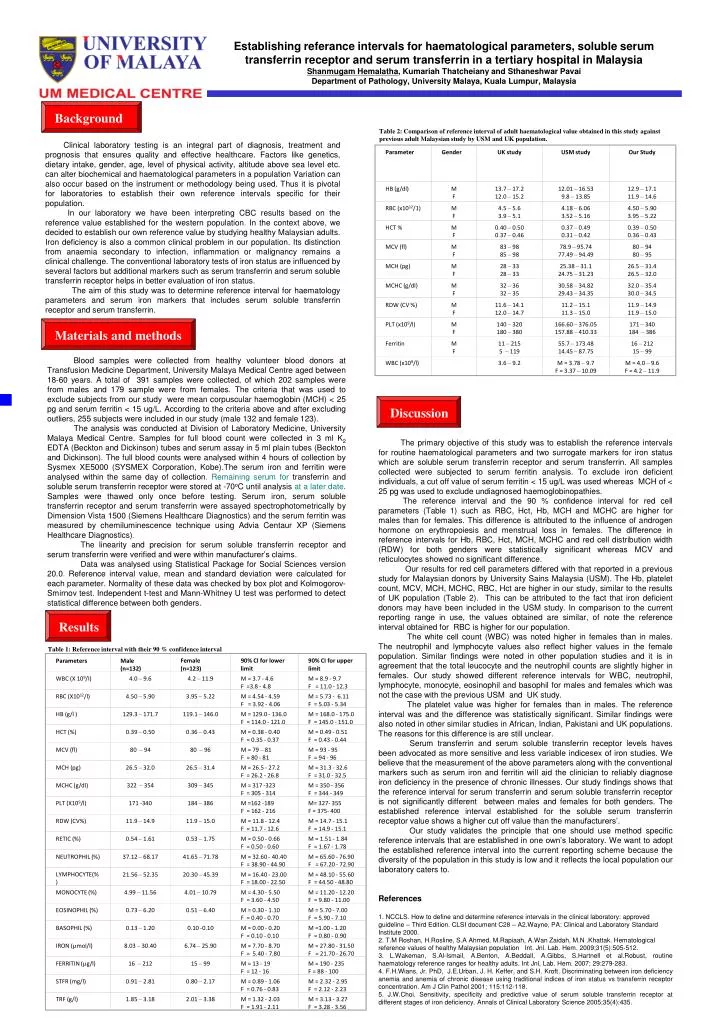
Parameter Parameters Gender Male (n=132) UK study Female (n=123) USM study 90% CI for lower limit Our Study 90% CI for upper limit WBC (X 109/I) 4.0 – 9.6 4.2 – 11.9 M = 3.7 - 4.6 F =3.8 - 4.8 M = 8.9 - 9.7 F = 11.0 - 12.3 HB (g/dl) M F 13.7 – 17.2 12.0 – 15.2 12.01 – 16.53 9.8 – 13.85 12.9 – 17.1 11.9 – 14.6 RBC (X1012/l) 4.50 – 5.90 3.95 – 5.22 M = 4.54 - 4.59 F = 3.92 - 4.06 M = 5.73 - 6.11 F = 5.03 - 5.34 RBC (x1012/1) M F 4.5 – 5.6 3.9 – 5.1 4.18 – 6.06 3.52 – 5.16 4.50 – 5.90 3.95 – 5.22 HB (g/l ) 129.3 – 171.7 119.1 – 146.0 M = 129.0 - 136.0 F = 114.0 - 121.0 M = 168.0 - 175.0 F = 145.0 - 151.0 HCT % M F 0.40 – 0.50 0.37 – 0.46 0.37 – 0.49 0.31 – 0.42 0.39 – 0.50 0.36 – 0.43 HCT (%) 0.39 – 0.50 0.36 – 0.43 M = 0.38 - 0.40 F = 0.35 - 0.37 M = 0.49 - 0.51 F = 0.43 - 0.44 MCV (fl) M F 83 – 98 85 – 98 78.9 – 95.74 77.49 – 94.49 80 – 94 80 – 95 MCV (fl) 80 – 94 80 – 96 M = 79 – 81 F = 80 - 81 M = 93 - 95 F = 94 - 96 MCH (pg) M F 28 – 33 28 – 33 25.38 – 31.1 24.75 – 31.23 26.5 – 31.4 26.5 – 32.0 MCH (pg) 26.5 – 32.0 26.5 – 31.4 M = 26.5 - 27.2 F = 26.2 - 26.8 M = 31.3 - 32.6 F = 31.0 - 32.5 MCHC (g/dl) M F 32 – 36 32 – 35 30.58 – 34.82 29.43 – 34.35 32.0 – 35.4 30.0 – 34.5 MCHC (g/dl) 322 – 354 309 – 345 M = 317 -323 F = 305 - 314 M = 350 - 356 F = 344 - 349 RDW (CV %) M F 11.6 – 14.1 12.0 – 14.7 11.2 – 15.1 11.3 – 15.0 11.9 – 14.9 11.9 – 15.0 PLT (X109/l) 171 -340 184 – 386 M =162 -189 F = 162 - 216 M= 327- 355 F = 375- 400 PLT (x109/l) M F 140 – 320 180 – 380 166.60 – 376.05 157.88 – 410.33 171 – 340 184 – 386 RDW (CV%) 11.9 – 14.9 11.9 – 15.0 M = 11.8 - 12.4 F = 11.7 - 12.6 M = 14.7 - 15.1 F = 14.9 - 15.1 Ferritin M F 11 – 215 5 – 119 55.7 – 173.48 14.45 – 87.75 16 – 212 15 – 99 RETIC (%) 0.54 – 1.61 0.53 – 1.75 M = 0.50 - 0.66 F = 0.50 - 0.60 M = 1.51 - 1.84 F = 1.67 - 1.78 WBC (x109/l) 3.6 – 9.2 M = 3.78 – 9.7 F = 3.37 – 10.09 M = 4.0 – 9.6 F = 4.2 – 11.9 NEUTROPHIL (%) 37.12 – 68.17 41.65 – 71.78 M = 32.60 - 40.40 F = 38.90 - 44.90 M = 65.60 - 76.90 F = 67.20 - 72.90 LYMPHOCYTE(%) 21.56 – 52.35 20.30 – 45.39 M = 16.40 - 23.00 F = 18.00 - 22.50 M = 48.10 - 55.60 F = 44.50 - 48.80 MONOCYTE (%) 4.99 – 11.56 4.01 – 10.79 M = 4.30 - 5.50 F = 3.60 - 4.50 M = 11.20 - 12.20 F = 9.80 - 11.00 EOSINOPHIL (%) 0.73 – 6.20 0.51 – 6.40 M = 0.30 - 1.10 F = 0.40 - 0.70 M = 5.70 - 7.00 F = 5.90 - 7.10 BASOPHIL (%) 0.13 – 1.20 0.10 -0.10 M = 0.00 - 0.20 F = 0.10 - 0.10 M =1.00 - 1.20 F = 0.80 - 0.90 IRON (µmol/l) 8.03 – 30.40 6.74 – 25.90 M = 7.70 - 8.70 F = 5.40 - 7.80 M = 27.80 - 31.50 F = 21.70 - 26.70 FERRITIN (µg/l) 16 – 212 15 – 99 M = 13 - 19 F = 12 - 16 M = 190 - 235 F = 88 - 100 STFR (mg/l) 0.91 – 2.81 0.80 – 2.17 M = 0.89 - 1.06 F = 0.76 - 0.83 M = 2.32 - 2.95 F = 2.12 - 2.23 TRF (g/l) 1.85 – 3.18 2.01 – 3.38 M = 1.32 - 2.03 F = 1.91 - 2.11 M = 3.13 - 3.27 F = 3.28 - 3.56 Establishing referance intervals for haematological parameters, soluble serum transferrin receptor and serum transferrin in a tertiary hospital in Malaysia Shanmugam Hemalatha, Kumariah Thatcheiany and Sthaneshwar Pavai Department of Pathology, University Malaya, Kuala Lumpur, Malaysia Background Table 2: Comparison of reference interval of adult haematological value obtained in this study against previous adult Malaysian study by USM and UK population. Clinical laboratory testing is an integral part of diagnosis, treatment and prognosis that ensures quality and effective healthcare. Factors like genetics, dietary intake, gender, age, level of physical activity, altitude above sea level etc.can alter biochemical and haematological parameters in a population Variation can also occur based on the instrument or methodology being used. Thus it is pivotal for laboratories to establish their own reference intervals specific for their population. Inour laboratory we have been interpreting CBC results based on the reference value established for the western population.In the context above, we decided to establish our own reference value by studying healthy Malaysian adults. Iron deficiency is also a common clinical problem in our population. Its distinction from anaemia secondary to infection, inflammation or malignancy remains a clinical challenge. The conventional laboratory tests of iron status are influenced by several factors but additional markers such as serum transferrin and serum soluble transferrin receptor helps in better evaluation of iron status. The aim of this study was to determine reference interval for haematology parameters and serum iron markers that includes serum soluble transferrin receptor and serum transferrin. Materials and methods Blood samples were collected from healthy volunteer blood donors at Transfusion Medicine Department, University Malaya Medical Centreaged between 18-60 years. A total of 391 samples were collected, of which 202 samples were from males and 179 sample were from females. The criteria that was used to exclude subjects from our study were mean corpuscular haemoglobin (MCH) < 25 pg and serum ferritin < 15 ug/L. According to the criteria above and after excluding outliers, 255 subjects were included in our study (male 132 and female 123). The analysis was conducted at Division of Laboratory Medicine, University Malaya Medical Centre. Samples for full blood count were collected in 3 ml K2 EDTA (Beckton and Dickinson) tubes and serum assay in 5 ml plain tubes (Beckton and Dickinson). The full blood counts were analysed within 4 hours of collection by Sysmex XE5000 (SYSMEX Corporation, Kobe).The serum iron and ferritin were analysed within the same day of collection.Remaining serum for transferrin and soluble serum transferrin receptorwere stored at -70oC until analysis at a later date.Samples were thawed only once before testing. Serum iron, serum soluble transferrin receptor and serum transferrin were assayed spectrophotometrically by Dimension Vista 1500 (Siemens Healthcare Diagnostics) and the serum ferritin was measured by chemiluminescence technique using Advia Centaur XP (Siemens Healthcare Diagnostics). The linearity and precision for serum soluble transferrin receptor and serum transferrin were verified and were within manufacturer’s claims. Data was analysed using Statistical Package for Social Sciences version 20.0. Reference interval value, mean and standard deviation were calculated for each parameter. Normality of these data was checked by box plot and Kolmogorov-Smirnov test. Independent t-test and Mann-Whitney U test was performed to detect statistical difference between both genders. The primary objective of this study was to establish the reference intervals for routine haematological parameters and two surrogate markers for iron status which are soluble serum transferrin receptor and serum transferrin. All samples collected were subjected to serum ferritin analysis. To exclude iron deficient individuals, a cut off value of serum ferritin < 15 ug/L was used whereas MCH of < 25 pg was used to exclude undiagnosed haemoglobinopathies. The reference interval and the 90 % confidence interval for red cell parameters (Table 1) such as RBC, Hct, Hb, MCH and MCHC are higher for males than for females. This difference is attributed to the influence of androgen hormone on erythropoiesis and menstrual loss in females. The difference in reference intervals for Hb, RBC, Hct, MCH, MCHC and red cell distribution width (RDW) for both genders were statistically significant whereas MCV and reticulocytes showed no significant difference. Our results for red cell parameters differed with that reported in a previous study for Malaysian donors byUniversity Sains Malaysia (USM). The Hb, platelet count, MCV, MCH, MCHC, RBC, Hct are higher in our study, similar to the results of UK population (Table 2). This can be attributed to the fact that iron deficient donors may have been included in the USM study. In comparison to the current reporting range in use, the values obtained are similar, of note the reference interval obtained for RBC is higher for our population. The white cell count (WBC) was noted higher in females than in males. The neutrophil and lymphocyte values also reflect higher values in the female population. Similar findings were noted in other population studies and it is in agreement that the total leucocyte and the neutrophil counts are slightly higher in females.Our study showed different reference intervals for WBC, neutrophil, lymphocyte, monocyte, eosinophil and basophil for males and females which was not the case with the previous USM and UK study. The platelet value was higher for females than in males. The reference interval was and the difference was statistically significant. Similar findings were also noted in other similar studies in African, Indian, Pakistani and UK populations. The reasons for this difference is are still unclear. Serum transferrin and serum soluble transferrin receptor levels haves been advocated as more sensitive and less variable indicesex of iron studies. We believe that the measurement of the above parameters along with the conventional markers such as serum iron and ferritin will aid the clinician to reliably diagnose iron deficiency in the presence of chronic illnesses. Our study findings shows that the reference interval for serum transferrin and serum soluble transferrin receptor is not significantly different between males and females for both genders. The established reference interval established for the soluble serum transferrin receptor value shows a higher cut off value than the manufacturers’. Our study validates the principle that one should use method specific reference intervals that are established in one own’s laboratory. We want to adopt the established reference interval into the current reporting scheme because the diversity of the population in this study is low and it reflects the local population our laboratory caters to. References 1. NCCLS. How to define and determine reference intervals in the clinical laboratory: approved guideline – Third Edition. CLSI document C28 – A2.Wayne, PA: Clinical and Laboratory Standard Institute 2000. 2. T.M Roshan, H.Rosline, S.A Ahmed, M.Rapiaah, A.Wan Zaidah, M.N .Khattak. Hematological reference values of healthy Malaysian population Int. Jnl. Lab. Hem. 2009;31(5):505-512. 3. L.Wakeman, S.Al-Ismail, A.Benton, A.Beddall, A.Gibbs, S.Hartnell et al.Robust, routine haematology reference ranges for healthy adults. Int Jnl, Lab. Hem. 2007; 29:279-283. 4. F.H.Wians, Jr. PhD, J.E.Urban, J. H. Keffer, and S.H. Kroft. Discriminating between iron deficiency anemia and anemia of chronic disease using traditional indices of iron status vs transferrin receptor concentration. Am J Clin Pathol 2001; 115:112-118. 5. J.W.Choi. Sensitivity, specificity and predictive value of serum soluble transferrin receptor at different stages of iron deficiency. Annals of Clinical Laboratory Science 2005;35(4):435. Discussion Results Table 1: Reference interval with their 90 % confidence interval