Download
1 / 1
10 likes | 69 Views
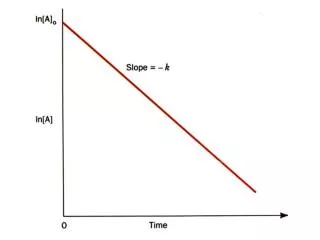
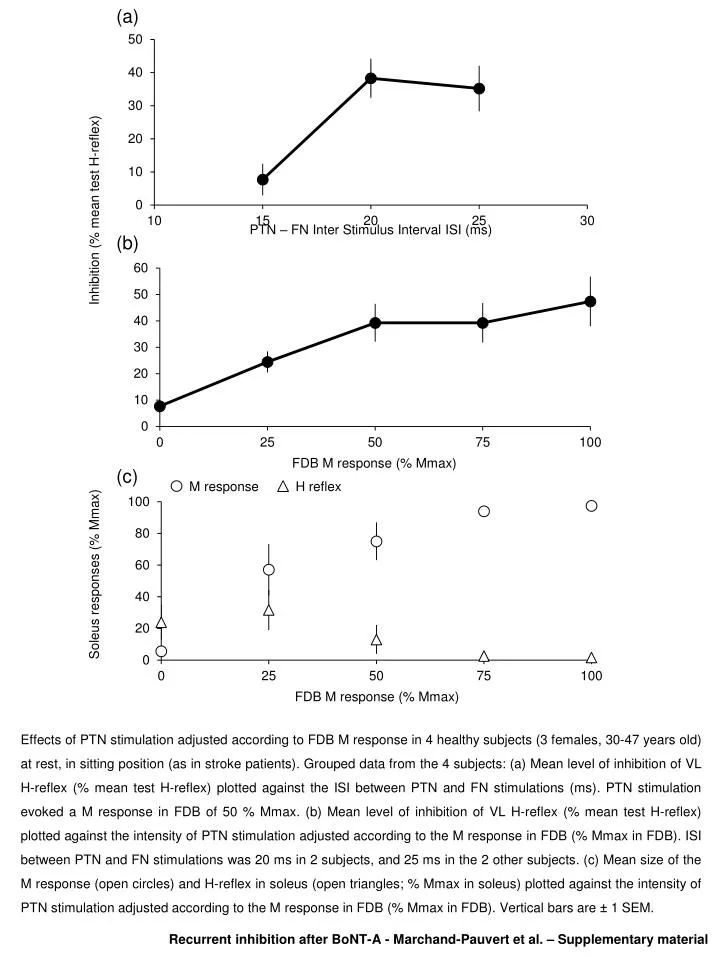
(a). Inhibition (% mean test H-reflex ). (b). (c). Soleus responses (% Mmax ).

E N D
(a) Inhibition (% mean test H-reflex) (b) (c) Soleusresponses (% Mmax) Effects of PTN stimulation adjusted according to FDB M response in 4 healthy subjects (3 females, 30-47 years old) at rest, in sitting position (as in stroke patients). Grouped data from the 4 subjects: (a) Mean level of inhibition of VL H-reflex (% mean test H-reflex) plotted against the ISI between PTN and FN stimulations (ms). PTN stimulation evoked a M response in FDB of 50 % Mmax. (b) Mean level of inhibition of VL H-reflex (% mean test H-reflex) plotted against the intensity of PTN stimulation adjusted according to the M response in FDB (% Mmax in FDB). ISI between PTN and FN stimulations was 20 ms in 2 subjects, and 25 ms in the 2 other subjects. (c) Mean size of the M response (open circles) and H-reflex in soleus (open triangles; % Mmax in soleus) plotted against the intensity of PTN stimulation adjusted according to the M response in FDB (% Mmax in FDB). Vertical bars are ± 1 SEM. M response H reflex Recurrent inhibition after BoNT-A - Marchand-Pauvert et al. – Supplementary material