1 / 24

Figure 10.1 Color CRT and Phosphor Dots on Face of Display.

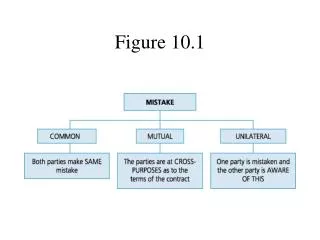
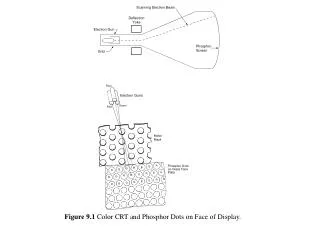
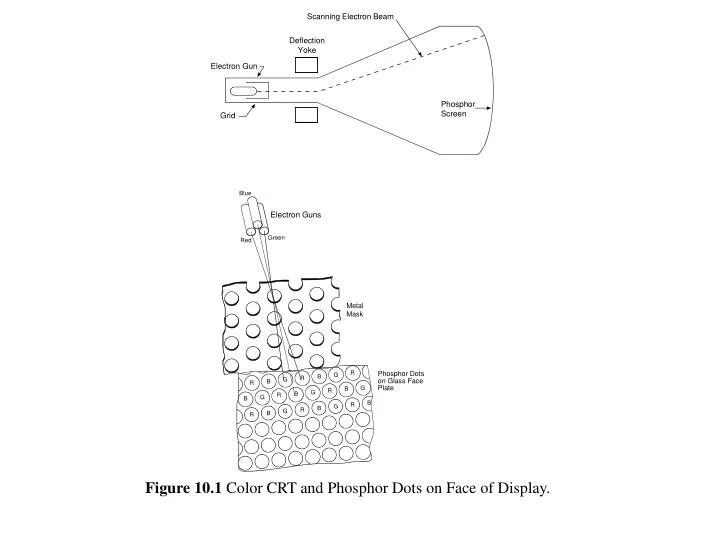
Figure 10.1 Color CRT and Phosphor Dots on Face of Display. Figure 10.2 VGA Image - 640 by 480 Pixel Layout. Figure 10.3 Vertical Sync Signal Timing. Figure 10.4 Horizontal Sync Signal Timing. Figure 10.5 CLPD based generation of VGA Video Signals. UP3core VGA_SYNC.

buck
Download Presentation

Figure 10.1 Color CRT and Phosphor Dots on Face of Display.

An Image/Link below is provided (as is) to download presentation Download Policy: Content on the Website is provided to you AS IS for your information and personal use and may not be sold / licensed / shared on other websites without getting consent from its author. Content is provided to you AS IS for your information and personal use only. Download presentation by click this link. While downloading, if for some reason you are not able to download a presentation, the publisher may have deleted the file from their server. During download, if you can't get a presentation, the file might be deleted by the publisher.

E N D

More Related