Download
1 / 33
360 likes | 497 Views
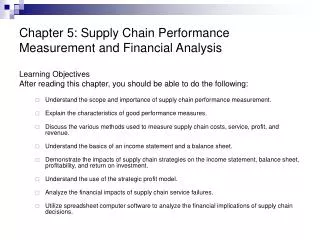
SUPPLY CHAIN PERFORMANCE MEASUREMENT AND FINANCIAL ANALYSIS. Learning Objectives. Understand the scope and importance of supply chain performance measurement. Explain the characteristics of good performance measures.

E N D
Learning Objectives • Understand the scope and importance of supply chain performance measurement. • Explain the characteristics of good performance measures. • Discuss the various methods used to measure supply chain costs, service, profit, and revenue. • Understand the basics of an income statement and a balance sheet.
Learning Objectives, continued • Demonstrate the impacts of supply chain strategies on the income statement, balance sheet, profitability, and return on investment. • Understand the use of the strategic profit model. • Analyze the financial impacts of supply chain service failures. • Utilize spreadsheet computer software to analyze the financial implications of supply chain decisions
Dimensions of Supply Chain Performance Metrics • Measures • Require no calculations and are uni-dimensional • Metric • Requires calculation and often contains several measures • Index • Combines two or more metrics into a single value
Figure 5.1 Characteristics of a Good Measure Source: Koebler, Durtsche, Manrodt, & Ledyard, Keeping score: Measuring the business value of logistics in the supply chain (Univ. Tennesee Council of Logistics Management, 1999) p8
Figure 5.2Distribution Center Metrics Source: 2010 Metrics Report, WERC, (May 26, 2010).
Figure 5.3Raising the Performance Bar Source: Koebler, Durtsche, Manrodt, & Ledyard, Keeping score: Measuring the business value of logistics in the supply chain (Univ. Tennesee Council of Logistics Management, 1999) p8
Developing Supply Chain Performance Metrics • Establish top management support for the development of a supply chain metrics program • Establish a supply chain metrics consistent with corporate strategy • The development of a metrics program should be the result of a team effort. • Involve customers and suppliers in the metrics development process, when appropriate. • Develop a tiered structure for the metrics. • Identify metric “owners” and tie metric goal achievement to an individual’s or division’s performance evaluation. • Establish a procedure to mitigate conflicts arising from metric development and implementation.
Figure 5.4Process Measure Categories Source: Koebler, Durtsche, Manrodt, & Ledyard, Keeping score: Measuring the business value of logistics in the supply chain (Univ. Tennesee Council of Logistics Management, 1999) p8
Performance Categories • Time • Captures the effectiveness dimension • Cost • Captures the efficiency dimension • Quality • Captures the customer service dimension • Other / Supporting • Supply chain operations & reference (SCOR) model by the Supply Chain Council (SCO) • Order cycle time (OCT) • Once an expected order cycle time is established for customers, service failures can be measured. • OCT influences product availability, customer inventories, and seller’s cash flow and profit.
Figure 5.5SCOR Model: Delivery Process Metrics (D1) Source: Adapted from Supply Chain Council 2011
Figure 5.6SCOR Model: Delivery Process Metrics (D1.3) Source: Adapted from Supply Chain Council 2011
Figure 5.7Logistics Quantification Pyramid – another categorization of performance metrics Source: R.A. Novak, Center for Supply Chain Research, Penn State University (2010)
The Supply Chain – Finance Connection • Focusing on the resources the supply chainutilizes is an effective means to improving financial performance. • Inventory levels affect the amount of capital required to finance the inventory. • Supply chain efficiency impacts time to process an order in its order-cash cycle time.
Table 5.1Sales Equivalent of Cost Savings Source: Edward J. Bardi, Ph.D.
Table 5.2Equivalent Sales with Varying Margins Source: Edward J. Bardi, Ph.D.
The Supply Chain Financial Impact • A major financial objective for any organization is to produce a satisfactory return for stockholders. • The absolute size of the profit must be considered in relation to the stockholders’ net investment, or net worth. • An organization’s financial performance is also judged by the profit it generates in relationship to the assets utilized, or return on assets (ROA). • Return on assets (ROA) is a metric that is used as a benchmark to compare management and organization performance to that of other firms in the same or similar industry. • The supply chain plays a critical role in determining the level of profitability in an organization.
Figure 5.9Supply Chain Impact on ROA Source: R.A. Novak, Center for Supply Chain Research, Penn State University (2010)
Figure 5.11Supply Chain Decisions and ROA Source: R.A. Novak, Center for Supply Chain Research, Penn State University (2010)
Financial Statements Two most important financial statements: • Income statement • details income and cost. • Balance sheet • details assets and liabilities
Figure 5.10Supply Chain Impact on Balance Sheet Source: R.A. Novak, Center for Supply Chain Research, Penn State University (2010)
Financial Impact of Supply Chain Decisions • A 10% reduction • In transportation, warehousing, or inventory cost • will lead to significant impacts on the financial statements
Figure 5.14Impact of 10% Transportation Reduction Source: Edward J. Bardi, Ph.D.
Figure 5.15Impact of 10% Warehousing Reduction Source: Edward J. Bardi, Ph.D.
Figure 5.16Impact of 10% Inventory Reduction Source: Edward J. Bardi, Ph.D.
Figure 5.18Strategic Profit Model & Reduced Transportation Costs Source: Edward J. Bardi, Ph.D.
Supply Chain Service Financial Implications • The results of supply chain service failures are added to the cost to correct the problem and lost sales. • At the occurrence of a service failure, some experiencing the service failure will request that the order be corrected, while other customers will refuse the order. • The refused orders represent lost sales revenue that must be deducted from total sales. • For the rectified orders, the customers might request an invoice deduction to compensate them for any inconvenience or added costs.
Figure 5.19Supply Chain Service Failure Source: Edward J. Bardi, Ph.D.
Figure 5.20Financial Impact of Improving On-Time Delivery Source: Edward J. Bardi, Ph.D.
Figure 5.22Strategic Profit Model & On-Time Delivery Improvement Source: Edward J. Bardi, Ph.D.
Summary • Performance measurement for logistics systems and especially for supply chains is necessary but it is challenging because of their complexity and scope. • Certain objectives should be incorporated into good metrics – be quantitative, be easy to understand, involve employee input, and have economies of effort. • Important guidelines for metric development for logistics and supply chains include consistency with corporate strategy, focus on customer needs, careful selection and prioritization of metrics, focus on processes, use of a balance approach, and use of technology to improve measurement effectiveness. • There are four principal categories for performance metrics: time, quality, cost, and miscellaneous or support. Another classification for logistics and supply chains suggests the following categories for metrics: operations cost, service, revenue or value, and channel satisfaction.
Summary, continued • The equivalent sales increase for supply chain cost saving is found by dividing the cost saving by the organization’s profit margin. • Supply chain management impacts ROA via decisions regarding channel structure management, inventory management, order management, and transportation management. be analyzed using the strategic profit model (SPM). • Alternative supply chain decisions should be made in light of the financial implications to net income, return on assets (ROA), and return on equity (ROE). • The SPM shows the relationship of sales, costs, assets, and equity; it can trace the financial impact of a change in any one of these financial elements. • Supply chain service failures result in lost sales and re-handling costs. The financial impact of modifications to supply chain service can be analyzed using the SPM.