Download
1 / 18
190 likes | 203 Views
Norwegian Marine Insurance Statistics. Underwriting Year 1990 - 2001 as of 31st December 2001. Norwegian Marine Insurance Statistics As of 31st December 2001. Index 1. Introduction 2. Fleet characteristics 2.1 Number of 2.1.1 … fleets and vessels per underwriting year

E N D
Norwegian MarineInsurance Statistics Underwriting Year 1990 - 2001 as of 31st December 2001
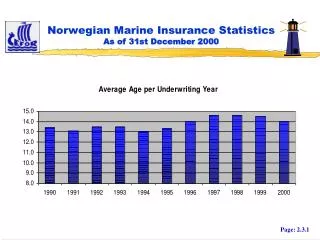
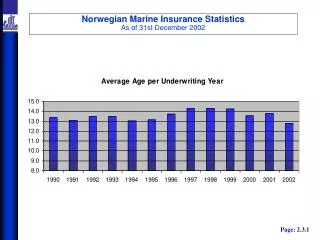
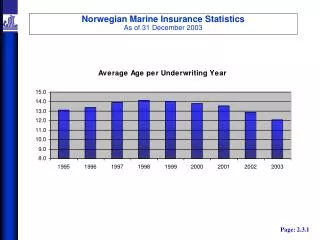
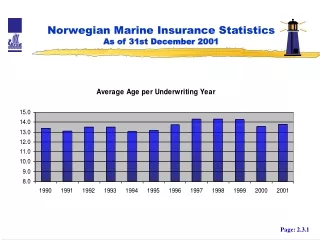
Norwegian Marine Insurance StatisticsAs of 31st December 2001 Index 1. Introduction 2. Fleet characteristics 2.1 Number of 2.1.1 … fleets and vessels per underwriting year 2.1.2 … vessels per type of vessel 2.1.3 … vessels per classification society 2.1.4 … vessels per flag 2.2 Total (F)DWT 2.2.1 … per underwriting year 2.2.2 … per type of vessel 2.2.3 … per classification society 2.2.4 … per flag 2.2.5 … per size group 2.2.6 … per age group 2.3 Average age 2.3.1 … per underwriting year 2.3.2 … per type of vessel, 2000 2.3.3 … per classification society 2.3.4 … per flag 2.3.5 Age structure per classification society in 2000 and 2001 Page: I
Norwegian Marine Insurance StatisticsAs of 31st December 2001 3. Insurance/Premium report 3.1 Total sum insured 3.1.1 … per underwriting year 3.1.2 … per type of vessel 3.1.3 … per size group 3.1.4 … per age group 3.1.5 … per classification society, 6 largest 3.1.6 … per flag, 8 largest 3.2 Total premium 3.2.1 … per underwriting year 3.2.2 … per type of vessel 3.2.3 … per size group 3.2.4. … per age group 3.2.5 … per classification society, 6 largest 3.2.6. … per flag, 8 largest Page: II
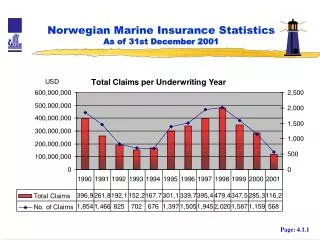
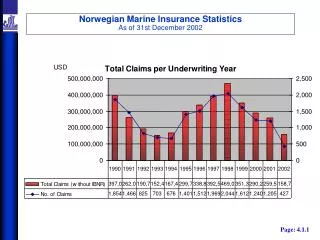
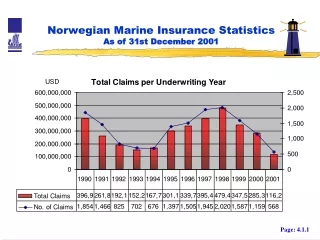
Norwegian Marine Insurance StatisticsAs of 31st December 2001 4. Casualty report 4.1.1 Total claims per underwriting year 4.1.2.a Number of claims per type of vessel 4.1.2.b Cost of claims per type of vessel 4.1.3.a Number of claims per age group 4.1.3.b Cost of claims per age group 4.1.4.a Number of claims per type of casualty 4.1.4.b Cost of claims per type of casualty 4.1.5 Number of claims per type of casualty - Period 1996 - 2000 4.1.6 Cost of claims per type of casualty - Period 1996 - 2000 5. Underwriting results and trends 5.1.1 Underwriting results as of 31.12.2001 - Total results for all risks registered by NoMIS 5.1.2 Underwriting results as of 31.12.2001 - Average results per vessel per underwriting year 5.2.0 Calculation methods for Index key factors and Rating Development 5.2.1 Index key factors 5.2.2 Rating development 5.2.3 Adjusted rating development 5.2.4 Average deductible development Page: III
Norwegian Marine Insurance StatisticsAs of 31st December 2001 Introduction The Norwegian Marine Insurance Statistics (NoMIS) is a co-operation between four of the members of the Central Union of Marine Underwriters (CEFOR) for the purpose of compiling and processing statistical information. Until 1997 the data was compiled by appointing NoMIS a compulsory facultative reinsurer to which the member companies ceded 0.1% of their hull and machinery insurance. In addition to the regular information about premiums and claims exchanged on bordereaux, the lead insurer provided NoMIS with a detailed breakdown of each claim. Since 1990, this improved material has been available to the members of NoMIS, providing statistics and analyses enabling them to enhance their underwriting and risk assessment. In 1998 it was decided to discontinue the facultative insurance agreement in favour of updating the NoMIS database electronically. The consequent necessary amendments to the database as well as the routines for updating were developed in 1999 and tested by the members in cooperation with CEFOR. In 2000 a further step was taken to restructure the database, such that from underwriting year 1995 all business underwritten by the NoMIS members is now updated electronically. This enables the NoMIS’ members to show up to date figures at any time for all Underwriting Years. As of 31 December 2001 the NoMIS database comprises 53,167 vessel years and 20,113 claims. This report contains statistics based on both Norwegian and International business for the period 1990-2001. Page: 1.1.1
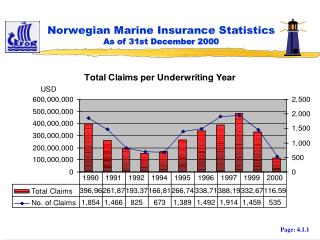
Norwegian Marine Insurance StatisticsAs of 31st December 2001 All presentations are in USD and the figures have been converted from the original currencies into USD based on the rate of exchange applicable: - Premiums: average monthly rate of exchange of the month of transaction - Paid claims: average monthly rate of exchange of the month of transaction - Outstanding claims: average monthly rate of exchange of December 2001 All premiums are net of all rebates and commissions. All claims are net of any deductibles applicable. (F)DWT in this report represents the maximum of either FDWT or DWT per vessel with Formula deadweight tons FDWT calculated as: Length between perpendiculars * Moulded breadth * Moulded depth 2.265 Total Claims = Paid Claims + Outstanding Claims Loss Ratio = Total Claims / Premium Underwriting year = year in which the insurance attaches Page: 1.1.2
Norwegian Marine Insurance StatisticsAs of 31st December 2001 Types of vessels specified BULK Bulk, Ore CAR/RoRo/CONT. Car Carrier, Ro/Ro, Container CHEM./PRODUCT Chemical Carriers Product GENERAL CARGO Dry Cargo, General Cargo, Reefers, Multi-Purpose, Pallett Vessels LNG/LPG LNG, LPG, LNG/LPG, Other Gas Carriers OBO Combined vessels, Bulk Container, Obo, Probo, O/O OTHER Other special vessels, Flo/Flo, Cable Lying Barge, Floating Crane, Heavy Lift, Barge/Pontoon, Barge Carrier (LASH), Tug, Fishing Factory, Fishing Vessel, Cement Carriers, Other Cargo Carriers, Coast Tanker, Work Boats, Coaster General Cargo, Floating Dock, Floating Crane, Coast Guard Vessels, Barges, Research Vessels, Sand Carriers Coaster, Pontoons, Ferry Boat, Tug/Salvage, Yacht, Floating Factory/Terminals, Undefined Page: 1.1.3
Norwegian Marine Insurance StatisticsAs of 31st December 2001 Types of vessels specified contd. PASSENGER Ferries, Other Passenger, Passenger Catamaran, Cruise ships, Hotel-Vessels, Car Passenger Ferries, Hurtigruteskip, Passenger Vessels, Other Liners Passenger/Cargo, Highspeed craft SUPPLY/OFFSHORE Other Offshore, Drilling Vessels, Diving/General Service Vessels, Barge/Pontoon, Stand-By, Seismic Search Vessels, Supply (Tug, Anchor), Tug/Icebreaker, Pipe Laying Barge/Vessel TANK Tankers, Asphalt Carriers, SPM Tanker, Oil Tanker Page: 1.1.4
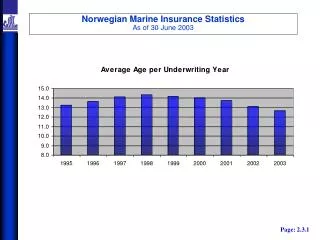
Norwegian Marine Insurance StatisticsAs of 31st December 2001 Page: 2.1.1
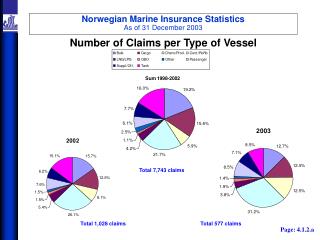
Norwegian Marine Insurance StatisticsAs of 31st December 2001 Number of vessels per type of vessel Total 30,792 Total 5,242 Total 5,193 Page: 2.1.2
Norwegian Marine Insurance StatisticsAs of 31st December 2001 Number of vessels per Classification Society Total 30,792 Total 5,242 Total 5,193 Page: 2.1.3
Norwegian Marine Insurance StatisticsAs of 31st December 2001 Number of vessels per Flag Total 30,792 Total 5,242 Total 5,193 Page: 2.1.4
Norwegian Marine Insurance StatisticsAs of 31st December 2001 Page: 2.2.1
Norwegian Marine Insurance StatisticsAs of 31st December 2001 Total (F)DWT per type of vessel Total 1,494 mill FDWT Total 290 mill FDWT Total 277 mill FDWT Page: 2.2.2
Norwegian Marine Insurance StatisticsAs of 31st December 2001 Total (F)DWT per Classification Society Total 1,494 mill FDWT Total 290 mill FDWT Total 277 mill FDWT Page: 2.2.3
Norwegian Marine Insurance StatisticsAs of 31st December 2001 Total (F)DWT per Flag Total 1,494 mill FDWT Total 277 mill FDWT Total 290 mill FDWT Page: 2.2.4
Norwegian Marine Insurance StatisticsAs of 31st December 2001 Total (F)DWT per Size Group Total 1,494 mill FDWT Total 290 mill FDWT Total 277 mill FDWT Page: 2.2.5
Norwegian Marine Insurance StatisticsAs of 31st December 2001 Total (F)DWT per Age Group Total 1,494 mill FDWT Total 290 mill FDWT Total 277 mill FDWT Page: 2.2.6