Download
1 / 12
120 likes | 238 Views
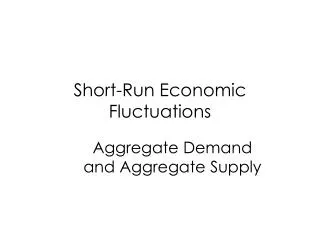
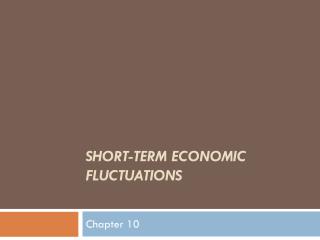
EXPLAINING SHORT-RUN ECONOMIC FLUCTUATIONS. Aggregate Demand and Aggregate Supply. Economists use the model of aggregate demand and aggregate supply to explain short-run fluctuations in economic activity around its long-run trend. Aggregate Demand and Aggregate Supply.

E N D
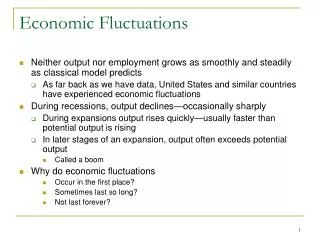
Aggregate Demand and Aggregate Supply • Economists use the model of aggregate demand and aggregate supply to explain short-run fluctuations in economic activity around its long-run trend.
Aggregate Demand and Aggregate Supply • The aggregate-demand curve shows the quantity of “Made in USA” goods and services that households, firms, the government, and foreigners want to buy at each price level. • The aggregate-supply curve shows the quantity of “Made in USA” goods and services that US firms would like to produce and sell at each price level.
Aggregate supply Equilibrium price level Aggregate demand Equilibrium output Figure 2 Aggregate Demand and Aggregate Supply... Price Level Quantity of 0 Output
P P2 1. A decrease Aggregate in the price demand level . . . Y Y2 2. . . . increases the quantity of goods and services demanded. Figure 3 The Aggregate-Demand Curve is downward sloping Price Level Quantity of 0 Output
Why the Aggregate-Demand Curve Is Downward Sloping: three reasons • The Wealth Effect: a lower price level boosts consumption spending by households • The Interest Rate Effect: a lower price level boosts investment spending by businesses • The Exchange-Rate Effect: a lower price level boosts net exports
Why the Aggregate-Demand Curve Is Downward Sloping: Wealth Effect • A decrease in the price level increases the purchasing power of consumers’ monetary wealth, which in turn encourages more consumption. • Besides, if a price decline is perceived to be temporary it would make sense to boost spending quickly, while prices are still low • This increase in consumer spending means larger quantities of goods and services demanded.
Why the Aggregate-Demand Curve Is Downward Sloping: Interest Rate Effect • A lower price level reduces interest rates. • Lower interest rates encourage greater investment spending (by businesses). • This increase in investment spending means a larger quantity of goods and services demanded.
Why the Aggregate-Demand Curve Is Downward Sloping: Exchange-Rate Effect • A decrease in the U.S. price level causes U.S. interest rates to fall • As a result, the value of the dollar decreases. • As a result, US goods become cheaper relative to foreign goods. • This makes U.S. net exports increase. • The increase in net export spending means a larger quantity of goods and services demanded.
Price Level D2 Aggregate demand, D1 Y2 Quantity of Output Shifts in the Aggregate Demand Curve We have seen why the AD curve is negatively sloped. We know why aggregate demand would increase from Y1 to Y2 when the price level decreases from P1 to P2. But what are the reasons why the AD curve might shift? In other words, what are the reasons why aggregate demand might increase to Y2 even if the price level stays put at P1? P1 P2 0 Y2 Y1
Why the Aggregate-Demand Curve Might Shift • Shifts arising from • Consumption: tax rates, prices of assets (stocks, bonds, real estate) • Investment: technological progress, business confidence, tax rates, money supply • Government Purchases • Net Exports: foreign GDP, expectations about exchange rates
AGGREGATE DEMAND • The four components of GDP (Y) contribute to the aggregate demand for goods and services. Aggregate Demand = C + I + G + NX • In equilibrium, supply = demand. So,Y = Aggregate Demand • Therefore, in equilibrium Y = C + I + G + NX