Download
1 / 4
40 likes | 205 Views
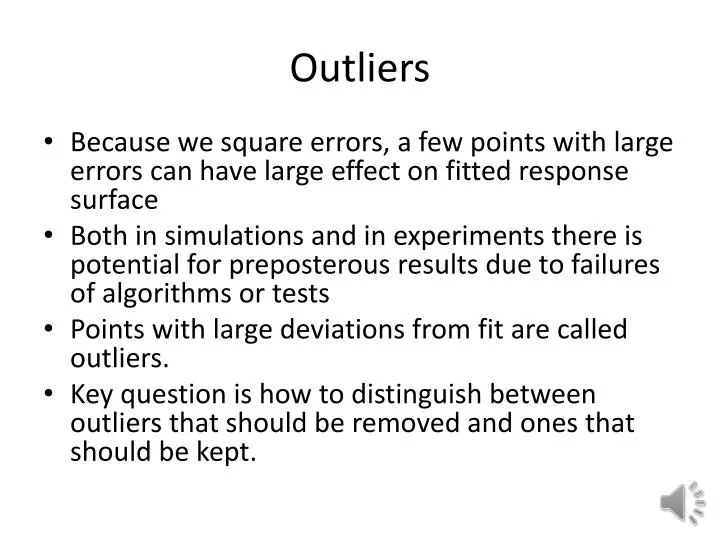
Outliers. Because we square errors, a few points with large errors can have large effect on fitted response surface Both in simulations and in experiments there is potential for preposterous results due to failures of algorithms or tests

E N D
Outliers • Because we square errors, a few points with large errors can have large effect on fitted response surface • Both in simulations and in experiments there is potential for preposterous results due to failures of algorithms or tests • Points with large deviations from fit are called outliers. • Key question is how to distinguish between outliers that should be removed and ones that should be kept.
Weighted least squares • Weighted least squares was developed to allow us to assign weights to data based on confidence or relevance. • Most popular use of weighted least squares is for moving least squares, where we refit data for each prediction point with high weights for nearby data. • Linear interpolation from a table is an extreme form. • Error measure • Normal equations
Determination of weights • One of the simplest is Huber’s • Once you add the weight, the fit and the errors will change and you will need to iterate, hence the name of the method, iteratively reweighted least squares. • If the point is an outlier, the fit will progressively move away from it until its weight is very small • Matlab’srobustfit implements Huber and a few other alternatives. For estimating it uses = MAD/0.6745 • MAD is the median absolute deviation of the absolute errors from their median • It also adjusts by multiplying it by
Example x = (1:10)'; y = 10 - 2*x + randn(10,1); y(10) = 0; bls = regress(y,[ones(10,1) x]) brob = robustfit(x,y) bls = 7.8518 -1.3644 brob = 8.4504 -1.5278 >> scatter(x,y,'filled'); grid on; hold on plot(x,bls(1)+bls(2)*x,'r','LineWidth',2); plot(x,brob(1)+brob(2)*x,'g','LineWidth',2) legend('Data','Ordinary Least Squares','Robust Regression')