Download
1 / 15
150 likes | 246 Views
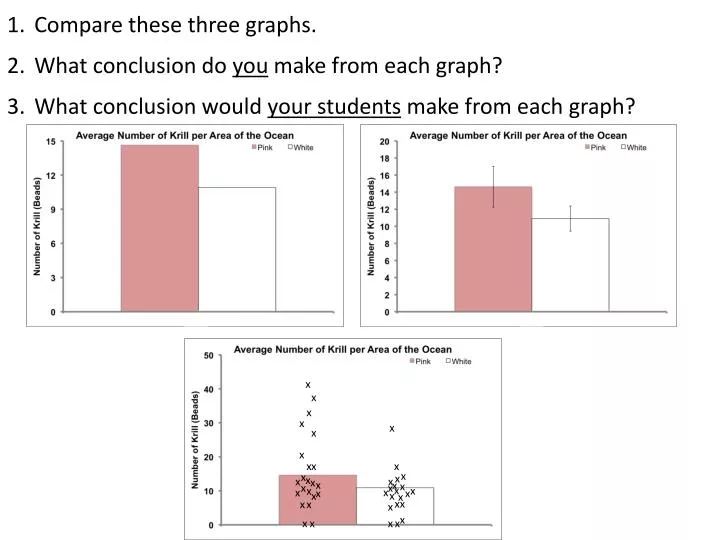
Compare these three graphs . What conclusion do you make from each graph? What conclusion would your students make from each graph?. x. x. x. x. x. x. x. x. x. x. x. x. x. x. x. x. x. x. x. x. x. x. x. x. x. x. x. x. x. x. x. x. x. x. x. x. x. x. x.

E N D
Compare these three graphs. What conclusion do youmake from each graph? What conclusion would your students make from each graph? x x x x x x x x x x x x x x x x x x x x x x x x x x x x x x x x x x x x x x x x x x
Convection vs. ConvergenceDeep vs. Surface CurrentsGlobal vs. Regional vs. Local Scale
Asking questions (for science) and defining problems (for engineering) Using mathematics and computational thinking Engaging in argument from evidence Planning and carrying out investigations Developing and using models Obtaining, evaluating, and communicating information Constructing explanations (for science) and designing solutions (for engineering) Analyzing and interpreting data
Checklist & Revisions(your questions) • Question begins with How, What, When, Who, or Which. • Question is measurable or able to be investigated with data. (**available to or accessible by you) • Question includes effects/variables being investigated. • Only 1-2 effects/variables are included in question.
Checklist & Revisions(student questions) • Question begins with How, What, When, Who, or Which. • Question is measurable or able to be investigated with data. (**available to or accessible by them) • Question includes effects/variables being investigated. • Only 1-2 effects/variables are included in question.
Getting students to ask questions • Work in grade-bands • Brainstorm the process you will use or strategies to help your students develop their testable questions for the investigations. • Make a list of key points you all come up with and will utilize with your students to present to the group.
Question Formulation Technique™ • The QFT is a simple, but rigorous, step-by-step process designed to help students produce, improve and strategize on how to use their questions. • The QFT allows students to practice three thinking abilities in one process: divergent, convergent and metacognitive thinking. • Components of QFT: • The Question Focus (QFocus) • The Rules for Producing Questions • Producing Questions • Categorizing Questions • Prioritizing Questions • Next Steps • Reflection