Download
1 / 29
290 likes | 482 Views
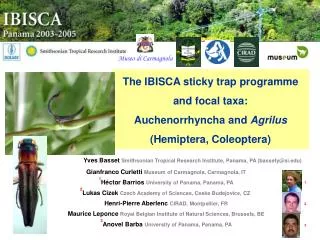
Museo di Carmagnola. Project IBISCA - One example: Beta-diversity and stratification of Auchenorrhyncha in a Panamanian rainforest. Yves Basset Smithsonian Tropical Research Institute, Panama, PA (bassety@si.edu) Gianfranco Curletti Museum of Carmagnola, Carmagnola, IT

E N D
Museo di Carmagnola Project IBISCA - One example: Beta-diversity and stratification of Auchenorrhyncha in a Panamanian rainforest Yves Basset SmithsonianTropical Research Institute, Panama, PA (bassety@si.edu) Gianfranco Curletti Museum of Carmagnola, Carmagnola, IT Héctor Barrios University of Panama, Panama, PA Lukas Cizek Czech Academy of Sciences, Ceske Budejovice, CZ Henri-Pierre Aberlenc CIRAD, Montpellier, FR Maurice Leponce Royal Belgian Institute of Natural Sciences, Brussels, BE Anovel Barba University of Panama, Panama, PA
Background (IBISCA) The IBISCA sticky trap programme (prel.) Distribution patterns of homopteran bugs (prel.) Conclusions Oronoqua
IBISCA IBISCA Investigating the BIodiversity of Soil and Canopy Arthropods Inventaire de la Biodiversité des Insectes du Sol et de la Canopée Investigaciones sobre la Biodiversidad de los Insectos de la Selva Centro-Americana
Scope of IBISCA: • 30 entomologists in the field; > 30 taxonomists in laboratories • 50 field participants (climbers, botanists, students, technical staff, etc.) • canopy access in situ, with different methods • 9 sites + seasonal replication • 14 sampling programmes (incl. sticky traps) • 60 focal taxa (different phylogenies and life histories) (incl. Auchenorrhyncha)
San Lorenzo Canopy Crane IBISCA sites
9 sites (20mx20m), including 3 within the crane perimeter Within 2km of the canopy crane Vegetation surveyed (DBH > 10mm)
Sticky traps Basset, Curletti, Barrios, Cizek & Aberlenc
The sticky trap programme Understorey Upper canopy Estimates the flight activity of smaller insects For each of 9 sites in 2003: 25 traps set in the understorey 25 traps set in the upper canopy 3 transects of traps set at 0, 1.3, 7, 14, 21, 28m and top (upper canopy) Traps run for 5 days Replication of two sites (crane) in March, May and October 2004 Total: 993 traps and 54,779 individuals collected Sorted by higher categories (families) with focal taxa extracted Measurements of light and canopy openness near each trap in situ (SRT)
Arthropod abundance per site Each method tend to be dominated by certain taxa Characterisation of sites by vegetation analysis and Mantel tests/ordinations Swampy, closer to river Close to stream, crane More open, and disturbed
Litter comparable to upper canopy in terms of abundance Hiatus between the upper canopy and the lower foliage Upper canopy: 86.3±3.7 Mid-canopy: 38.2±2.5 Understorey:33.1±1.1 Litter: 70.3±7.6 Flight-intercept traps
(se) 26.8 ±7.99 Patterns of stratification differ between taxonomical and ecological groups For example: Predatory flies, sap-sucking bugs, scavenging flies and wood-boring beetles show different patterns
Positive correlation between arthropod abundance and light, rs = 0.273, P < 0.001 Relationships with canopy openness and leaf density not assessed yet Relationships with remote sensing data not assessed yet
Distribution patterns of homopteran bugs (all sap-suckers) Planthoppers (Fulgoroidea) Leafhoppers (Membracoidea) Treehoppers (Membracoidea) Froghoppers (Cercopoidea) Cicadas (Cicadoidea) Jumping plant lices (Psylloidea) Zammara Enchophora Not considered here: scales, whiteflies and aphids
Collecting effort by method (no. ind.) Total 15,245 homopterans Challenge: To account for different sampling efforts among sampling methods and habitats Biolleyana
Cicadellidae: UND+UPC Aleyrodidae: UPC Cixiidae, Derbidae, Tropiduchidae: UND Membracidae: UPC Psyllidae: UPC Cercopoidea Cicadoidea Fulgoroidea Psylloidea Membracoidea Others Dorisiana Faunal composition per habitat: homopteran families
Faunal composition by habitats: Leafhoppers (Cicadellidae, subfamilies) Deltocephalinae: UND Typhlocybinae, Xestocephalinae: UND Iassinae, Neocoelidiinae: UPC Cicadellinae: UND+UPC Scarinae: everywhere
Roots/fungi: UND Meristems: UPC Distribution of individuals per guilds and habitats Taxa with nymphs feeding on roots/fungi are more likely to occur as adults on the lower vegetation Taxa with nymphs feeding on meristems are more likely to occur as adults on the upper vegetation Sphongophorus
Species richness No. species Cicadellidae 158 Typhlocybinae 50 Cicadellinae 36 Scarinae 23 Deltocephalinae 14 Derbidae 73 Membracidae 56 Achilidae 28 Cixiidae 18 Delphacidae 17 Flatidae 16 Psyllidae 15 Etc. Total 447 species As of March 2005: 71% of spp. identified to genus 29% of spp. identified to species Collections: NMNH, Washington NHM, London MNHN, Paris Fidicina
Randomized species accumulation curves per habitat Estimates of species richness (Chao1) Lit 126 spp. Und 355 spp. Can 302 spp. Upp Can 289 spp. Rarefaction per 1,000 ind. (Coleman) Und 147 spp. Can 194 spp. Upp Can 146 spp. Canopy Understorey Upper Canopy Litter
Vertical stratification: juveniles and similarities among habitats Echetra Lower matrix of similarity (spp.) (Morishita-Horn) Stratification of juveniles Low similarities among habitats
Similarity matrices among habitats with seasonal replication: Results for sticky traps at sites C1, C2 (directly comparable) Isolation of the fauna in the upper canopy Highest similarity between the understorey and canopy during the dry season (more open) Oronoqua
Site variables Resolution not good enough
CCA of well-represented homopteran species (n = 66, 20 ind.) ordered by sites Total inertia = 1.508 Sum eigenvalues CCA = 1.050 (69% of variance, p = 0.03) Axis 1 & 2 = 60% (42%) of CCA Result similar with sticky traps for first replication (better calibrating but loss of information) Athestia
No. of species collected at each site Coleman rarefaction to 295 individuals Limitations: Sample size different among methods/sites [No fogs at C1-3; MT stolen at B2, etc.]
Correlations between rarefied no. of species at each site (295 ind.) and site variables Best (n.s.) = NDVI Note: BA-NDVI: r=-0.68, p<0.05 Better calibrating, Mantel tests Miranha
Summary of species distribution • Criteria: • 97 spp. with ind. 12 • Specialists: 90% of population • concentrated in one strata/site • No. of states identical: 3 strata (L+UND), • sites grouped into 3 larger sites (location) No. of extreme specialists: 9 (9%) No. of strata specialists: 30 (31%) No. of site specialists: 12 (12%) No. of extreme generalists: 37 (38%) Extreme specialists uncommon When specialization occurs, more likely to be related to strata (habitat) than site But need to refine analyses (habitat definition) Correlation between site occupancy and population size
Conclusions - Sticky traps • Each collecting method is biased towards particular group/species, • with concomitant problems in the analysis of spatial patterns • Differences in arthropod abundance between sites difficult to explain • More activity at the level of the litter and upper canopy • Gap in arthropod activity between the upper canopy and lower foliage • Patterns of stratification differ between taxonomical and ecological • groups • Incident light along the vertical profile is a good predictor of • arthropod abundance (but there may be better variables)
Conclusions - homopteran bugs • Stratification is obvious at the level of families, subfamilies and species • Low similarity among strata, maintained during different seasons • Fungal-feeders well-represented in the understorey, meristem-feeders • in the upper canopy • More species collected in the understorey, rarefaction similar for • understorey and upper canopy; mid-canopy enriched • Distance (floristic composition, NDVI?) and illumination of sites • important, not the number of plant species per se • Extreme specialists not common, specialization more towards • strata than site
Acknowledgements: our sponsors, the IBISCA team and taxonomic help: D. Burckhardt, S. McKamey, L. O’Brien, C. Simon & M. Webb Part of IBISCA participants during the field replication of May 2004